Massive Federal Reserve still growing amidst inflation
By Bill Bergman. March 10, 2022
In banking and insurance, rapid growth can be a red flag. It’s easy to grow in these industries, at least in the short run, by underpricing services and assuming higher risk.
Today, the Federal Reserve Board issued its weekly “H.4.1” statistical release. This report, titled “Factors Affecting Reserve Balances of Depository Institutions and Condition Statement of Federal Reserve Banks,” contains a consolidated balance sheet for the 12 Federal Reserve Banks.
Reserve Bank assets totaled $8.9 trillion in the latest week, up from a month earlier, which in turn was higher than the month before that. The Federal Reserve continues to grow, not shrink, even as inflation has accelerated in recent months.
At $8.9 trillion, the Fed’s total assets were nearly 20% higher than a year ago – and more than twice as high as a few short years ago.
The Fed’s balance sheet is now 10 times as large as it was back in 2006, before its response to the financial and economic crisis of 2008-2009 – a crisis in important part of the Fed’s own making.
There’s no such thing as a free lunch, the saying goes. Is our massive, rapidly growing central bank a source of strength for the government? Even if it is, what’s good for the government isn’t always good for the Average Joe and Jane.
Are our fiscal and monetary oligarchs doubling down on their bets, with citizens in general bearing the downside risk?
Below are many of the hundreds of blog articles I wrote at Truth in Accounting in the decade ended early 2022.
Did Chicago’s finances improve last year?
July 13, 2018
Yes and no, depending on what you mean by “Chicago,” and what you think of the Rule of Law.
The “bottom lines” for Chicago’s income statement and balance sheet both suggested continued deterioration last year, but a closer look presents a mixed picture.
The city’s overall reported financial condition continued to deteriorate, even after especially bad years reported for 2015 and 2016. The city’s reported expenses exceeded fees, grants, and general revenues (taxes), by nearly $1 billion, in line with results in 2012-2014. That loss (in the income statement, called the “Statement of Activities”) was consistent with a continued decline in the net position on the balance sheet (the “Statement of Net Position”).
The nearly $1 billion income statement loss arrived despite reported overall expenses falling almost 20%. The city’s revenues have been catching up to expenses, at least according to these reported numbers, just not enough. Total expenses still run significantly ahead of revenues, despite relatively rapid revenue growth.
Things get interesting when you consider that expectations for sharply higher city contributions to pension plans (and associated tax increases) drove the reported expense decline in 2017, as well as a significant reduction in the net pension liability.
Things get really interesting (and significantly more complicated) when you ask the question why the city’s net position fell further, despite that fact that reported assets rose while reported liabilities declined.
Normally, when assets go up and liabilities go down, the net position improves, right? Not in state and local government land, where the accounting standard setters have recently introduced (a topic for another day, or century) extraordinary new accounts called “Deferred Outflows of Resources” (included near and added to the assets) and “Deferred Inflows of Resources” (included near and added to the liabilities).
Longer story short, significant questions attach to the validity and significance of these ‘deferred’ accounts. Ignoring them, it looks like the city’s finances improved. The city's finances may have improved, but that doesn't necessarily mean that Chicagoans' finances improved, if they are going to be paying significantly higher taxes.
But if recent experience is a guide, the anticipated increases in contributions to employee pension plans driving the reported pension liability reduction may not come to pass. Five years ago, two of the largest plans (Chicago police and firefighter pensions) were expecting significant increases in contributions from 2013 to 2017. The statutory contribution reported for the police fund in 2017 came about $100 million (20%) below what was projected in 2013 for 2017.
Laws come and go, and the ability and willingness of the government to abide by its own laws can be problematic.
Consider that the City of Chicago’s recently released annual report was not available until July 11, even though state law requires it to be published by June 30. And the date on the letter of transmittal (addressed in part to the citizens of the City of Chicago) was June 29, the day before the legal deadline.
Skimming the news—about states that are ‘skimming’
July 24, 2018
Some government funds flow into a variety of tributaries.
Our daily Morning Call e-newsletter summary included two articles today that identified subsets of the 50 states engaged in interesting - and curious - financial practices.
An article in the Daily Signal by Fred Lucas (“Trump Administration Takes on Unions Over ‘Skimming’ Medicaid Payments”) discusses how 11 states deduct a portion of money paid to Medicaid service providers, and send that money to public-sector unions.
And in an article for Forbes (“Yes, Let’s Expand Social Security – To Public Sector Employees”), Elizabeth Bauer identified 15 states where public-sector employees aren’t covered by Social Security.
The issues in these articles deserve more thorough analysis and discussion. But for now, let’s take a look at those first 11 states, and see how they compare to the rest of the 50 states on a number of economic, demographic, and financial characteristics. We can do that using Truth in Accounting’s State Data Lab website.
The 11 states that “skim” Medicaid include California, Connecticut, Illinois, Maryland, Massachusetts, Minnesota, Missouri, New Jersey, Oregon, Vermont, and Washington.
Skimming this list of “skimming” states, it looks like many of them are near the bottom of the barrel in our ranking of the 50 states based on their financial condition. That’s certainly the result—the average Taxpayer Burden™ we calculate for these states comes to $27,000, more than four times as high as the average for the other 37 continental states..
Which comes first, the chicken or the egg? Are states in bad shape because they take money from programs for poor people and give it to their public-sector unions? Are states that take money from services for poor people to give it to public-sector unions doing so because they are in bad financial shape? What else is going on beneath the surface?
We aren’t going to answer those kinds of questions here, but consider some other interesting relationships:
· As one might expect, public sector union representation is higher in the skimming states. The average share of the public-sector workforce covered by collective bargaining agreements is about 50 percent in those 11 states, compared to an average 30 percent in the other states.
· The share of Medicaid enrollment in total population is not significantly different between the skimming and non-skimming states. However, the share of doctors accepting new Medicaid patients (a measure of Medicaid service quality for poor people) was running significantly lower in the skimming’ states a few years ago, while the Medicaid-to-Medicare fee index was running significantly higher in the skimming states than the other states.
· Governments often contract with nonprofits to provide social services for poor people. In recent years, growing financial stress in some governments has been reflected in late and/or lower payments not only to doctors in the Medicaid program, but for nonprofit organizations that provide these services. In a recent survey, the share of nonprofits reporting significant problems with late payments on these contracts ran significantly higher in the skimming states than the other states.
· The states that skim Medicaid payments rank significantly lower than the other states on citizen trust in state government, looking at a recent nationwide public opinion poll.
The Forbes article was not, strictly speaking, about public-sector unions. But the article citation for the list of the 15 states was linked to the National Education Association, a teachers’ union described by Wikipedia as “the largest labor union and professional interest group in the United States.”
The NEA introduced its list of 15 states as “states in which public employees are not covered by Social Security,” and they included Alaska, California, Colorado, Connecticut, Georgia, Illinois, Kentucky, Louisiana, Maine, Massachusetts, Missouri, Nevada, Ohio, Rhode Island, and Texas.
We’ll take a closer look at these 15 states, and broader questions relating to both articles, another day.
Addendum: This article started with the sentence "Some government funds flow into a variety of tributaries." I just looked up "tributary" in the dictionary, to make sure I had the right metaphor. The definition includes "1) a river or stream flowing into a larger river or lake. 2) historical -- a person or state that pays tribute to another state or ruler."
Is Chicago a government version of Enron?
July 31, 2018
The Enron blow-up in 2001 provided lessons to be wary of off-balance-sheet debts. Today, City of Chicago provides some eerie similarities.
Chicago has accumulated rapidly growing debt, including bank loans and bonded debt, as well as obligations in other places. For many years, some of the largest debts (pension and health care benefits for retired employees) were left off the city’s balance sheet. That has changed in recent years as governmental accounting standards have finally required them to be included.
But the City of Chicago does not include a few interesting things on its financial statements. These include the Chicago Public Schools (CPS), the Chicago Housing Authority, the Chicago Transit Authority, and the Chicago Park District.
CPS paints its own dire financial picture, but Chicago does not blend the large negative financial position for CPS in the city’s own balance sheet.
How does it justify this? Chicago’s latest annual financial report notes “The financial reporting entity consists of the City and its component units, which are legally separate organizations for which the City is financially accountable. … The City’s officials are responsible for appointing a voting majority of the members of the boards of other organizations, but the City’s accountability for these organizations does not extend beyond making appointments and no financial accountability or fiscal dependency exists between the City and these organizations.”
Back in the late 1990s, Enron was providing a seemingly smashing success story. Enron’s stock price ballooned from about $10 per share in the early 1990s to a high of $90, before crashing to Earth (and $0) in 2001. Enron’s reported financials were masking a complex Ponzi scheme, one that relied on deceptive reporting to keep a spigot of fresh money coming in the door—until it didn’t.
The complex deals in Enron’s tool chest were in an area called “structured finance.” A respected textbook on the subject by Frank Fabozzi, Henry Davis and Moorad Choudhry called out some of Enron’s practices by saying “Liabilities that truly have no recourse to a company’s shareholders can justly be treated as off-balance-sheet. Enron appears to have violated this principle …”
In 2003, Bethany McLean and Peter Elkind told the Enron story in a best-selling book (which turned into a successful movie) titled “The Smartest Guys in the Room.” Summarizing some of the skullduggery, the authors stated “All the structured-finance deals Fastow and his team cooked up were meant to accomplish a fairly simple set of goals: keep fresh debt off the books, camouflage existing debt, book earnings, or create operating cash flow. At their absolute essence, the deals were intended to allow Enron to borrow money – billions upon billions of dollars that it needed to keep itself going – while disguising the true extent of its indebtedness.”
Granted, Enron was a pretty unique case, and Chicago is joined by other cities in not consolidating public school systems in its own books. And Chicago funding includes a significant slice of tax money, which arrives not exactly freely but through a rule of law (and force). But the similarities are a little disturbing.
In this light, consider the City of Chicago’s current and ongoing claim that “no financial accountability or fiscal dependency exists between the City and these organizations” – including the Chicago Public Schools.
The following quotes are lifted directly from the latest proposed budget for the Chicago Public Schools. Do you think any fiscal dependency exists?
· “The FY2019 budget also includes nearly $1 billion in capital spending — the largest single-year investment since the Mayor of the City of Chicago became accountable for the performance of CPS.”
· “CPS has received more than $1.3 billion in TIF funds for capital investments in schools throughout the city over the past decade.”
· “On top of capital expenditures on schools, Mayor Emanuel is also committed to declaring a surplus of TIF funds each year.”
· “ … “All other local” revenue includes the pension payment made by the City of Chicago on behalf of CPS employees to the Municipal Employees’ Annuity and Benefit Fund of Chicago (MEABF), and is estimated to be $52 million in FY2019. It is recorded as revenue as required by the Governmental Accounting Standards Board (GASB).”
· “FY2019 local contributions to capital projects are expected to be $32.5 million. This includes $18 million in TIF-related project reimbursements and $14.5 million from other local funding sources.”
· “Other Federal Grants …include competitive grants for other specific purposes. Below is a brief description of major grants under this category … CPS Head Start programs are funded through the City of Chicago. CPS anticipates receiving $36 million for the FY2019 Head Start program to serve all eligible enrolled students.”
· “The Law Department provides legal services to the Chicago Board of Education, schools, and the departments and divisions of the Chicago Public Schools. … MAJOR ACCOMPLISHMENTS … Drafted, negotiated, and/or provided advice concerning more than 1,000 contract matters, including: (a) a $1 million grant agreement from the City of Chicago Department of Family Support and Services to assist CPS in curricula development, instructional support, and computer science toolkits to help high schools develop implementation plans for the new Computer Science graduation requirement …”
· “Debt Management … CPS funds its Capital Improvement Program largely through the issuance of bonds. … As of June 30, 2018, the Board of Education has approximately $8.2 billion of outstanding long-term debt and $600 million of outstanding short-term debt. … CPS issues bonds backed by the full faith and credit of the Board, otherwise known as General Obligation (GO) Bonds. These GO bonds are paid for from all legally available revenues of the Board. … The first revenue source that is supporting CPS bonds is one of the following: EBF, Personal Property Replacement Taxes (PPRT), revenues derived from intergovernmental agreements with the City of Chicago, property taxes, and federal interest subsidies. The majority of CPS bonds are backed by EBF. … Additionally, $113 million in debt service will be paid by revenue resulting from Intergovernmental Agreements with the City of Chicago.”
· “By law, the City of Chicago has been contributing to the Municipal Employees’ Annuity and Benefit Fund of Chicago on behalf of the Board’s educational support personnel (ESP).”
· “Inter-government Agreement (1997 IGA) with City of Chicago - October 1, 1997: … The 1997 IGA represents a unique financing arrangement between the city of Chicago and the Chicago Public Schools to pay for the construction of new schools, school building additions, and renovation of existing schools and equipment. Per the agreement, the city will help the Board to finance its Capital Improvement Program by providing it with funds to be used to pay debt service on bonds issued by the Board for such purpose. The amount to be provided by the city will be derived from the proceeds of ad valorem taxes levied in future years by the city on all taxable property.”
Massachusetts town police force quits en masse
August 1, 2018
NBC News reports that the entire police force (4 officers) of Blandford, Mass., (population 1,253) quit yesterday. The officers issued a statement citing concerns about how the town is asking them to patrol in cars without air conditioning, properly working brakes, snow tires, or four-wheel drive.
One has to wonder whether city financial problems are part of the equation, so I checked out the town’s website and found that the list of annual financial statements ends at 2011.
When I called town administrator’s office to inquire more about the recent financial reports, I was told the town simply hasn’t published them since 2011. This year, however, Blandford has retained outside accountants, and the town official expressed confidence that they can produce audited results again.
While the town website does have a version of a financial report for 2018 up there, it’s a video that starts with an interesting choice in background music — Getting Better by The Beatles.
Chicago’s new budget document shows city finances ‘getting better’
August 1, 2018
Chicago’s latest Annual Financial Analysis (released yesterday) suggests that city finances are still deteriorating.
The document's base outlook projects what the city calls a “structural budget deficit” (an excess of forecast expenditures over revenue) of nearly $100 million in 2019. These fiscal forecasts have been improving in recent years, as stressed by the Mayor, at least in the sense that the projected deficit has been declining. But in the end, a deficit is still a deficit.
It is worth noting that these annual projections include not only the next budget year, but the following year as well. Last year, the city projected a base outlook deficit of $212.7 million for 2019. While this year’s expectation is for a deficit of about $100 million in 2019, the projections for future years’ deficits continue to climb (i.e., negative numbers getting bigger).
It is also worth stressing, every year, that these budget reports are not actual results, but projections. There are words and there are deeds, and the results of the deeds arrive in the audited annual financial statements. Those statements are based on more reliable accrual-based accounting standards, and have shown expenses running ahead of revenues in recent years, leading to significant declines in Chicago’s net financial position even as the city maintains that it balances its budget as required by state law.
We’ll be taking a deeper dive into Chicago’s latest Annual Financial Analysis soon, but it is worth starting with the very first substantive section in the report: the “Disclaimer and Advice to Readers.” The city began including a disclaimer in the budget document in the Annual Financial Analysis for 2016; previously, the first section of the report was the “Letter from the Mayor.”
A new paragraph in the disclaimer this year reads as follows:
“Readers are cautioned not to place undue reliance on the prospective financial information. Neither the City, the City’s independent auditors, nor any other independent accountants have compiled, examined, or performed any procedures with respect to the prospective financial information contained herein, nor have they expressed any opinion or any other form of assurance on such information or its achievability, and assume no responsibility for, and disclaim any association with, the prospective financial information.”
In other words, don’t pay too much attention to this.
Chicago’s pension obligation bonds – swapping one credit card for another?
August 16, 2018
The City of Chicago is reportedly considering a pension obligation bond offering. The city could issue $10 billion in bonds, and use the proceeds to fund its pension plans. A decision could come as soon as Friday.
The idea has been criticized from several quarters. One critic called it “just swapping one credit card for another.”
It could be significantly worse than that. Here’s a simple scenario illustrating what can happen with pension obligation bonds, depending on how they are structured.
Let’s assume a simple city that has two main parts – a pension plan for employees, and everything else in city government. Assume the rest of the city’s government has $500 in assets, no debt, and therefore a net position (assets less liabilities) of $500. The city’s pension plan has assets of $500, but a liability (to pensioners) of $1,500, and therefore a negative net position ($1,000).
Consolidating the rest of the city with its pension plan, you have an organization with $1,000 in assets, $1,500 in liabilities, and a negative net position of $500.
Now, let’s ‘fix’ that pension plan. We borrow $1,000, selling a pension obligation bond. We take the proceeds, and put them into the pension plan.
Poof, problem solved? The pension plan’s funded ratio goes from 33 percent (500/1500) to 100 percent (1500/1500).
But what about the rest of the city, and the consolidated balance sheet?
The consolidated balance sheet a) gets bigger, and b) gets more risky. Total assets go from $1,000 to $2,000, as assets managed for the plan go up. Liabilities go up by the amount of the bond offering, rising from $1,500 to $2,500. The net position ($2,000-$2,500) is unchanged (negative $500), consistent with a neutral ‘swapping one credit card for another’ interpretation.
But consider a 20 percent decline in the value of the investments in the pension plan, and what happens to the consolidated net position before and after the pension obligation bond.
Without the pension obligation bond, assets in the pension plan fall $100, leaving a net position for the consolidated enterprise of $900 less $1,500, or negative $600 (down from a negative $500).
Adding the pension bond, and assuming the same 20 percent decline in the value of invested assets in the pension plan, the pension plan assets fall from $1,500 to $1,200, leaving the consolidated enterprise with $1,700 in assets, $2,500 in liabilities, and a negative net position of $800 – a bigger hit (from a negative $500 to negative $800) than the impact that would have arrived without the pension bond.
How about the rest of the city? Before the pension bond, the rest of the city had $500 and no debt. With the pension obligation bond, the city issues the bond, puts the proceeds in the pension plan. Total assets stay the same ($500), while total liabilities rise (from $0 to $1,000), turning a positive net position of $500 into a negative net position (negative $500).
But the pensioners feel better, given that fund assets are higher and more unambiguously in the pension plan.
Are states sitting on piles of cash, at the expense of their cities?
August 21, 2018
Last week, Timothy Williams wrote an article in the New York Times examining a debate in some states over what to do with rising ‘surpluses,’ and whether they should be saved in rainy-funds or redistributed to cities with pressing cash-flow requirements. Among other things, he penned “Still, the combination of a surplus and fresh revenue means that states that had endured years of involuntary frugality are virtually swimming in cash.”
The rhetoric over surpluses, and public perception, could benefit from a refresher course on the differences between cash-flow accounting and accrual accounting. They could also benefit from reminders about the differences between income statements and cash flow statements, on the one hand, and balance sheets, on the other hand.
Consider a family running a current cash flow surplus, but it has two daughters about to head off to college for the fall semester. They just took out large student loans to help the girls get to their launch pads. Should this family go out to dinner every night this week, and celebrate their departure?
That’s an unfair comparison, of course. Cities looking at states ‘swimming in cash’ assert they have pressing requirements for their citizens.
But maybe some of those states and their city children need to pay more attention to the longer-term consequences of past and current financial practices, buckle their belts, and get more efficient.
Another distinction between the family example and the state/city comparison has to do with mobility. What if that family is in a state asserting ‘balanced budgets,’ and ‘current surpluses,’ but has accumulated massive long-term debts that have to paid down the road?
Families can move. States and cities can’t.
What is the PBGC, and why should you care about it?
August 23, 2018
Concerns have been growing over the financial health of the federal government’s Pension Benefit Guaranty Corporation (PBGC). This entity backs up “private sector” pension plans, but failures to adequately fund the plans backed by the backstop, as well as the backstop itself, now threaten the pensions of millions of workers and retirees.
Those threatened now include taxpayers, given the PBGC is a federal government entity.
Late last year, an Ohio senator introduced the “Butch Lewis Act of 2017.” Among other elements, the proposed law would create a new Pension Rehabilitation Trust Fund authorized to make loans to troubled pension plans.
Earlier this year, Congress created a new joint House/Senate Committee dedicated to the issues underlying multiemployer pension plans and the PBGC. The Joint Select Committee on Solvency of Multiemployer Pension Plans is chaired by Sen. Orrin Hatch (R-Utah) and Rep. Sherrod Brown (D-Ohio). Back in April, this committee issued a request for comments on the Butch Lewis Act and related issues.
But in an ominous sign, the request for input identified who the Committee was seeking input from. The statement said they were seeking out the views of ‘stakeholders,’ with Rep. Brown identifying ‘workers, retirees, and businesses.’
He didn’t identify taxpayers, or citizens, as stakeholders.
You can participate anyway, though. Comments are due mid-September.
Should ‘state stress tests’ stress pensions, or states?
August 24, 2018
In 2010, on the heels of the worst financial crisis since the Great Depression, Congress enacted the Dodd-Frank Act. Section 165 of this 849-page law directed the Federal Reserve Board of Governors to develop and apply “stress tests” to large bank holding companies and other financial institutions.
Stress tests are hypothetical accounting and financial modelling exercises that attempt to estimate the impact of adverse economic and financial market developments on the soundness of financial firms. The conduct and implications of these tests have had mixed reviews. Some proponents contend stress tests improve the resilience and stability of the financial system. Critics question whether those tests have been sufficiently stressful, and some even question their utility at all.
Anat Admati, a finance professor at Stanford University and an advocate for significantly higher capital requirements in banking, has called the tests a “charade.” Kevin Dowd wrote an analysis for the Cato Institute titled “Math Gone Mad,” which argues the tests in practice actually “create the potential for a new systemic crisis.”
Banks aren’t the only stressful financial institutions around. The concept of stress testing has spread. The Pew Charitable Trusts, a widely cited authority on pension plans, has been banging the drums especially hard this year. Pew, together with Harvard’s Kennedy School of Government, has developed a set of modelling tools for states to apply in stress tests for their pension plans. A growing number of states has begun to require these tests.
It sure sounds good, on the surface. Why not subject these risky pension plans to rigorous scrutiny? Isn’t that a responsible thing to do?
In practice, however, stress tests have the potential to bias risk allocation in ways preferred by well-organized special interest groups, at the expense of citizens, taxpayers, and the Average Joe and Jane.
Take a peek at a lengthy paper Pew issued a few months ago. Titled “Assessing the Risk of Fiscal Distress for Public Pensions: State Stress Test Analysis,” Greg Mennis, Susan Banta and David Draine reported on the results of applying their tests to public pension plans in 10 states, and recommended that stress tests become a standard reporting practice for all public-sector retirement systems.
Consider who they stressed, however. The title may have been subtitled “State Stress Test Analysis,” but states weren’t the organizations being stressed. The pensions were the object of the analysis.
Improving the stability of pension finances may reduce risks for state government operations and taxpayers. However, focusing on pensions and reducing plan risk can also come at the expense of, and pose higher risk to, other government operations, as well as taxpayers and citizens.
In their May 2018 paper, for example, Mennis, Banta and Draine praise Wisconsin and North Carolina for demonstrating “how strong funding policies can help to ensure that public pension systems are sustainable and secure.” Wisconsin and North Carolina certainly rank high on their pension funding status, among the 10 states covered by Pew as well as nationally. However, in our holistic analysis of state financial conditions, Wisconsin and North Carolina’s overall financial position don’t rank nearly as high as might be expected given the pension funding because bond borrowing debt runs relatively high in those states.
This can illustrate how a state might strategically work harder to improve its performance in pension stress tests, but at the expense of the general public. Consider what happens when a hypothetical state issues a bond, a bond so large that it leads its funded ratio to rise to 100 percent. The risk to the pension plan has certainly gone down, but the risk for the rest of the state government as a whole has increased.
Chicago is now considering a massive new bond offering designed to fund its woefully underfunded pension obligations. City leaders are reportedly briefing city aldermen ‘behind closed doors.’ The bond offering would certainly improve Chicago pension plans’ odds of passing stress tests. But it would also increase the size and risk of the city’s overall balance sheet.
Stress tests can be abused. If they can be applied honestly, they should focus on the right entity, not a special, favored subset of government.
Looking at Illinois and Indiana migration trends with State Data Lab
August 28, 2018
Truth in Accounting’s State Data Lab website includes a wide variety of demographic, economic and government financial information for all 50 states and 75 of the largest cities in the US.
“Where should you move?” is our theme of the week this week. State Data Lab can help inform your decision, if you are thinking along these lines.
You can also use State Data Lab to look at migration trends, even if you aren’t thinking about moving. We have a variety of population and related migration data in there.
For example, United Van lines, one of the largest interstate moving companies in the US, has published an annual migration study each year since 1978. We include the results from that study for all 48 continental states since 1978.
Let’s take a peek at Illinois and Indiana results on this study since 2005.
State Data Lab is really easy to use. Just go to the website (www.statedatalab.org). Then:
1. At the top of the front page, hover over “CHARTS.”
2. Click on “CREATE YOUR OWN CHART” in the dropdown box.
3. Click on Illinois and Indiana to choose those states, in Step 1. Then ...
4. Head down to the “DEMOGRAPHIC” section. The first subsection in there is called “Population.” Near the bottom of that section, click on “United Van Lines Outbound Shipments Percentage.”
5. Move down further, below all the data variables, to Step 3, “SELECT AVAILABLE YEARS.” Click on all the years 2005-2017 indvidually.
6. Then, below that, click on “GENERATE CHART.” A column chart will be generated. Change it to a line chart in the dropdown box. Here’s what you should see.
7. You can easily share this chart with others. One way is to generate a URL. Below the chart, in “SHARE YOUR CHART,” click on “Share Your Chart.” That will generate a unique URL that you can copy and send to others and they can click on it and get their own chart. Or, you can save the chart as a picture file, and send it that way.
It isn’t a pretty picture, for Illinois at least. Illinois is leading the nation in outbound moves in recent years. Consider the difference between Illinois and Indiana, and note that it isn’t the hardest comparison for Illinois, either – Indiana has had positive net outmigration in recent years.
Don’t worry about pension liabilities – the stock market went up a lot two years ago
August 30, 2018
Balance sheets and income statements have different time perspectives. Income statements tell a story about performance over a period of time, while balance sheets, in theory, tell a story about financial position at a point in time.
Income statements and balance sheets each lead to a bottom line that should inform the residual claim the enterprise is accountable to. On the income statement, revenue less expenses leave what is left over for the ultimate claim on the enterprise. On the balance sheet, assets less liabilities leave a net position.
For state and local governments, accounting standards have developed the Statement of Activities (the income statement) and the Statement of Net Position (the balance sheet). For decades, however, the Statement of Net Position excluded retirement benefit obligations from the debts, which have blossomed into the largest liabilities for many state and local governments.
In fiscal 2015, governments began including these debts, as they were finally required to do so. But the face of the balance sheet did not include investment assets supporting retirement plans, or the full liability estimated for those assets to support. Instead, they included the net pension liability – the full liability less the invested assets. Given that the vast majority of retirement plans operate with less assets than measured liability, this led to a large increase in reported debt, and significant deterioration in the net position.
But the way in which governments include this net liability on the balance sheet (the Statement of Net Position) has some very curious features. One of the strangest can be illustrated with a statement by Moody’s Investor Service a few days ago.
In a press release titled “Unfunded US state pension liabilities surge in fiscal 2017 due to poor investment returns,” Moody’s first paragraph reads as follows:
“The majority of US states experienced a sharp increase in their adjusted net pension liabilities (ANPL) in fiscal year 2017, owing to poor investment returns in fiscal 2016, Moody's Investors Service says in a new report. However, favorable investment returns in fiscal 2017 and 2018 are expected to lead to a decline in pension liabilities for the next two fiscal years.”
Fiscal 2016 ended, for most states, on June 30 2016. How can that lead to deterioration in net position for year-end fiscal 2017, you ask?
In turn, consider how Moody’s can accurately 'forecast' pension liabilities declining for the next two fiscal years, given that investment returns were so favorable over the past two years ended June 30, 2018.
So much for that “point in time” perspective for balance sheets.
New Hampshire’s “Economic Advantage” index - what does it tell Illinois?
August 30, 2018
Dave Lemery at Watchdog.org recently wrote an article titled, “New Index Seeks to Quantify ‘New Hampshire Advantage’ Over Neighboring States.” The article tells the story of a new index developed by the Granite Institute, a right-leaning public policy think tank . The index is used to compare New Hampshire to its neighbors on economic growth and factors that may promote (or impede) growth. The index appeared to confirm anecdotal references to the ‘New Hampshire Advantage,’ at least relative to neighboring states.
After reading the first two paragraphs, I stopped reading and tried to develop my own index, and to see how it performs compared to the index developed by the Granite Institute. It’s pretty easy to do, at least in quick and dirty fashion, with the tools available on our State Data Lab website.
Since 2003, New Hampshire’s GDP growth has been in the middle of the pack when compared to its neighbors. However, looking at New Hampshire and how it ranks on factors I selected as indicators that can matter for economic growth, New Hampshire indeed ranks highest among its neighbors.
The factors I selected (all of which can be found on State Data Lab) are Forbes’ Best States for Business rankings, the Cato Economic Freedom rankings, rankings on trust in state government according to the most recent Gallup poll, rankings for lawyers per capita (a proxy for regulation), and Truth in Accounting’s Taxpayer Burden rankings.
Collectively, these five indicators do a good job of explaining economic growth differences across the 50 states.
Looking at New Hampshire and its neighbors, here is the average rank for these five factors (the lower the number, the higher the ranking).
New Hampshire ranked the highest compared to its neighbors.
After putting this together, I went back and read the rest of the article. The Granite Institute’s index, which was developed by J. Scott Moody, also relies on five economic metrics, but different ones. They include the size of the private sector in the overall economy, taxes on individuals, taxes on consumption, taxes on businesses, and taxes on wealth.
It is useful to consider our Taxpayer Burden measure compared to current taxes of the types relied on by the Granite Index. “You can pay me now, or pay me later,” the saying goes. States can fund themselves with current taxes as well as accumulating debt, and the latter poses consequences for future taxpayers that can undermine economic growth.
But it is interesting that we came to similar conclusions, after taking different, independent routes. This analysis tends to support the Granite Institute’s conclusions.
Our State Data Lab facility can be used for analyses like this for any region you want.
For example, let’s do the same thing we did for New Hampshire and its neighbors to Illinois and its neighbors. In short, you end up with a chart like this:
Again, bigger isn’t better on this number. Illinois ranks the lowest, compared to its neighbors.
How will Libertarian party candidates fare at the polls in November?
September 7, 2018
We include the Democratic, Republican, and Libertarian party share of the popular vote in Presidential election years in our State Data Lab website.
Looking at the last five Presidential election years, here’s the Libertarian share of the popular vote, on average, across the 50 states:
Growing like a weed.
Was 2016 an anomaly, driven by the success (relatively speaking) of the candidate, Gary Johnson? Or is something more fundamental going on?
Should be fun to watch.
Parenthetically, just noting here that looking things over in State Data Lab, states with a higher Libertarian share of popular vote tend to be in better shape financially, looking at Truth in Accounting’s Taxpayer Burden measure.
Should public pension plan assets be managed for pensioners, or taxpayers?
September 20, 2018
Paul Rose is a law professor at The Ohio State University. Over the weekend, he had an article published in the Illinois Law Review titled “Public Wealth Maximization.” Rose makes a groundbreaking case for the fundamental reshaping of fiduciary duties of managers of public pension funds. Historically, they have been directed to pursue the best interests of plan beneficiaries. Rose argues that they should first and foremost be managed for the benefit of the general public – citizens and taxpayers.
As part of his argument, Rose notes that the legal position of pension plan participants behaves more like a senior claim on government, rather than the residual claim for shareholders in corporations, where managers owe a fiduciary duty to the residual claim. While it may seem that pension plan participants fare well when plan assets are invested well, and they fare poorly if plan assets are invested poorly, that just isn’t the case, especially in places like Illinois where defined pension benefits are guaranteed under state law.
So Rose argues that fiduciary duties should flow to the real risk takers – the public.
Consider a market crash. Do pensioners care? Not if their benefits are defined and guaranteed. Citizens and taxpayers are the ones on the hook. They’ve effectively been placed in the stock market, even if they don’t want to be there – just on the downside.
In discussing the implications of his argument, Rose focuses on what they can mean for investment choices, particularly in light of externalities and issues relating to socially-responsible investing. But his argument also has important – and likely good – implications for risk-shifting to taxpayers, and could result in ‘socially responsible’ investment decisions of a different sort, including less risky investment portfolios for public pension plans.
In a world where pension benefits are defined and guaranteed, and plan managers under a duty to care first and foremost about plan participants, there can be incentives to invest in riskier-than-socially-responsible portfolios when citizens and taxpayers bear any downside of risky investments.
In turn, the idea that pension plan assets should be managed with a view to the public as the residual claim supports an argument I am developing that GASB recognized pension liabilities on balance sheets incorrectly. After decades of leaving them off the balance sheet, GASB finally required the net pension liability – the total liability less plan assets – to be included in the debts of governments. One can make a case, and I am developing it, that GASB should have forced the recognition of the total liability as a debt, along with recognizing plan assets among the assets of the sponsoring government.
New “Zombie Index” helps illuminate risks facing taxpayers
October 9, 2018
In the last week we have had a healthy reminder that stock and bond prices can go down as well as up. Granted, a few days does not make a trend. But it always makes sense to consider darker possible scenarios, particularly for many state and local governments whose financial position has deteriorated since 2009 despite a huge apparent recovery in financial markets.
What would happen in the event of a large, sustained downturn in financial markets, perhaps arising with sustained higher long-term interest rates? Which of the United States are potentially at higher risk than others? With Halloween coming up, we’ve decided to revise and update the “Zombie Index” we include in our State Data Lab database.
This index is inspired by the work of Edward Kane, Professor of finance at Boston College. Kane wrote books warning about the developing crisis in the deposit insurance system in the late 1980s. Kane coined the term "zombie bank," referring to banks and thrifts that were effectively insolvent but allowed to remain open via untruthful accounting and regulatory forbearance.
Kane called them "zombies" because they were really dead but allowed to walk among the living, and false accounting delayed loss recognition. Zombies had incentives to take large risks to try, in Kane's words, to "gamble for resurrection" – especially considering moral hazard generated by expectations that taxpayers would get the downside of the gambles. These incentives, in Kane's view, amplified the cost of the savings and loan crisis for taxpayers.
Similar incentives may still exist today, for “too-big-to-fail banks” as well as troubled state and local governments facing huge shortfalls in their pension plans – shortfalls long left outside government balance sheets.
Our Zombie Index is based on five elements related to what Kane viewed as the factors in Zombie-ness. The first is Truth in Accounting's "Taxpayer Burden" (weighted at 25%), the second is the timeliness (or lack thereof) in filing the annual Comprehensive Annual Financial Report (weighted at 25%), the third is the trend in timeliness (weighted at 10%), the fourth is Truth in Accounting's "Transparency Score" (weighted at 25%) and the fifth is the average ratio of accrual expenses to accrual revenue in the last 10 years (a measure of whether governments really 'walk the talk' on balanced budget requirements, weighted at 15%).
States with higher "Zombie Index" scores may be more likely to be taking higher risks in their investments and other areas. The Zombie Index Ranking is from 1-50, with one indicating the highest Zombie Index ranking, and 50 indicating the lowest ranking.
We report the Zombie Index rankings for 2009 to 2014, and for 2017 onward. Beginning in 2015, state and local governments began including previously off-balance-sheet retirement benefit debt on their balance sheet, changing the nature of the "hidden debt" component previously included in our Zombie Index rankings. We substituted the Transparency Score for that component beginning in 2017, and added the trend in timeliness and the rolling 10-year average ratio of accrual expenses to accrual revenue in 2017 as well.
The biggest ‘Zombies?’ New Jersey, Massachusetts, New Mexico, Connecticut, and Illinois. Taxpayers and citizens in those states could benefit from more oversight of risk exposure in investments backing retirement funds. They might also benefit from some form of ‘prompt corrective action’ advocated by Kane and others for supervisors of failing banks – sooner than later.
Some related possible remedies could include Paul Rose's recent recommendations for considering fundamental changes in the fiduciary responsibilities for public pension fund managers, and Ed Kane's ideas about fiduciary duties for managers of “too-big-to-fail banks.”
Quiz of the Day
October 11, 2018
How many words are in the Illinois Municipal Code? These statutes govern municipalities in Illinois.
a) 510
b) 2,645
c) 3,544
d) 587,287
Answer(s): a) The word ‘money’ appears 510 times in the Illinois Municipal Code. b) There are 2,645 words just in the table of contents in the Illinois Municipal Code. c) The word ‘tax’ appears 3,544 times in the Illinois Municipal Code. d) There are 587,287 words total in the Illinois Municipal Code, almost as many as the King James Bible. Copying and pasting the Illinois Municipal Code into a Word document takes some time, depending on your computer. The Word document runs more than 3,000 pages long.
Chicago’s new ‘balanced’ budget – more of the same
October 18, 2018
Chicago Mayor Rahm Emanuel on Wednesday delivered his annual budget speech.
This was his last budget address, given that he didn’t choose to run for re-election. During his speech, Emanuel claimed that Chicago’s fiscal and economic health "is stronger than it has been in many years."
The veracity of this claim may depend on what the word ‘many’ means.
The mayor asked us to think about where the city was seven years ago.
So let’s do that, especially in light of how the city claims that it balances the budget every year "as required by state law."
Here are five things to take away from Emanuel's latest budget proposal.
1. It’s big.
2. It’s bigger than it used to be.
3. It’s “balanced” – again.
4. It’s “interesting”
5. There are “no new taxes.”
It’s big. Chicago’s new proposed budget calls for more than $10 billion in spending next year.
It’s bigger than it used to be. The proposed spending runs about 30 percent more than proposed in 2011 for 2012. This is curious in light of the mayor's claim, prior to his last re-election, to have “balanced the budget” without significant tax increases, by making the city “smaller, smarter, and simpler.”
It’s “balanced” – again. If the people taking care of your organization’s money told you that they were running a balanced budget, would you think your organization’s debt was going up? Wouldn’t a balanced budget at least keep your debt even, or even decline?
That’s not what’s been happening in Chicago. Expenses ran higher than revenue every year from 2011 to 2017.
From 2011 to 2017, the city’s total reported liabilities doubled, largely because the city finally began including pension obligations on its balance sheet a couple years ago. Excluding pensions, however, Chicago’s total reported liabilities still rose significantly from 2011 to 2017, reflecting how the city was running up the credit cards on its residents, even while telling them they were ‘balancing the budget.’
It’s “interesting.” The new budget includes more than $800 million proposed for debt service. This includes interest on bonded debt. Last year, the City of Chicago incurred more than $720 million in interest expense—up more than $200 million from 2011. That's a lot of dough, especially when it's generated by borrowing to fill gaps in “balanced” budgets.
There are “no new taxes.” Writing in Crain’s Chicago Business, Greg Hinz’s summary was headlined “No tax hikes, two big holes in Emanuel’s final budget.” Hinz is careful to qualify that there are no new tax or fee hikes “beyond those that already have been approved.” The city is in the midst of implementing large-scale property tax and other revenue increases, and the ability and willingness of taxpayers to fork over this money will be tested in the years ahead.
The Civic Federation supports the City of Chicago’s proposed budget
November 1, 2018
The Civic Federation released its annual review of Mayor Rahm Emanuel’s proposed budget for the coming fiscal year. The Civic Federation came out in support of the $8.9 billion budget proposal.
In the Chicago Sun-Times, Fran Spielman summarized the Civic Federation’s review as follows:
“Mayor Rahm Emanuel’s feel-good final budget is a “reasonable one-year financial plan” that keeps the city’s hand out of taxpayers’ pockets but “ignores an enormous elephant in the room,” the Civic Federation warned Wednesday.”
One might argue that it isn’t possible to have a reasonable one-year plan if it ignores an enormous elephant in the room. One could also argue that the city isn’t really taking its hand out of taxpayers’ pockets; the hand is still in there, just waiting for more money when it comes down the road.
In its full report, the Civic Federation cited the city’s projected $100 million shortfall in the Corporate Fund, calling it a “budget deficit.” A footnote that follows states “The City of Chicago is required by law to pass a balanced budget so it does not have a budget ‘deficit’ in the same sense that the federal government has a deficit.” The Civic Federation squared this circle by noting that the city ultimately balances the budget by measures introduced in the annual budget ordinance.
Trouble is, the city of Chicago’s expenses have exceeded revenue every year since 2010 by an average of $2 billion a year. How can you “balance a budget” every year, but spend more than you take in every year? Political math and bad accounting rules provide the answer.
Below is a compilation of the Civic Federation’s summary of this annual report from 2003 to 2018. Each year, the group introduces the report with a statement of support or opposition to the budget proposal. The Civic Federation supported the budget proposal in 13 of those 16 years.
Consider the arguments supporting the appraisal issued in 2010 (for FY2011), the last time the Civic Federation opposed the budget proposal, in light of the concerns cited in the Chicago Sun-Times article cited above.
xxxxx
October 31, 2018
The Civic Federation supports the City of Chicago’s proposed $8.9 billion FY2019 budget because it is a reasonable one-year financial plan that does not include any new taxes or fees, makes important public safety investments and funds the increased 2019 pension contribution of $32 million to the police and fire pension funds without a property tax increase.
November 8, 2017
The Civic Federation supports the proposed FY2018 City of Chicago budget of $8.6 billion because it continues to work toward stabilizing the City’s finances, puts its four pension funds on a path toward solvency and works to incorporate short-term capital expenses into the operating budget rather than funding them through borrowing.
November 1, 2016
In a report released today, the Civic Federation announced its support for the City of Chicago’s proposed FY2017 budget of approximately $8.2 billion because it continues to work toward addressing the City’s unfunded pension liabilities and makes significant improvements over past financial practices.
October 14, 2015
The Civic Federation supports the City of Chicago’s proposed $7.8 billion budget and necessary property tax increase as a long overdue action to address the City’s public safety pension funding crisis.
November 3, 2014
The Civic Federation supports the City of Chicago's proposed $7.3 billion budget because it reflects both reasonable structural changes and significant actions toward long-term stability, including the 2014 pension reform law for the City's Municipal and Laborers' pension funds and the continued phase out of the City's retiree health care subsidy.
November 13, 2013
The Civic Federation supports the City of Chicago’s proposed $7.0 billion budget as a reasonable short-term plan that closes approximately two-thirds of a $338.7 million budget gap with structural changes that will continue to reduce the City’s ongoing deficit.
October 31, 2012
The Civic Federation supports the City of Chicago’s FY2013 proposed $6.5 billion budget which reduces the City’s reliance on one-time revenue sources while restructuring City government through better managing personnel expenditures.
November 2, 2011
The Civic Federation supports the proposed FY2012 City of Chicago budget of nearly $6.3 billion because it takes effective action to reduce the City’s structural deficit through significant expenditure reductions and targeted revenue increases.
November 3, 2010
The Civic Federation opposes the proposed FY2011 City of Chicago budget of nearly $6.2 billion because it does not effectively address the structural deficit and relies too heavily on asset lease reserve funds and debt restructuring to close the $654.8 million budget deficit. The proposed budget would defer costs and postpone changes needed to align current year expenditures with recurring revenues.
November 18, 2009
The Civic Federation opposes the FY2010 City of Chicago budget of $6.14 billion because it is unsustainable and relies too heavily on one-time reserve funds to close a $520.0 million budget deficit.
November 5, 2008
The Civic Federation supports the FY2009 City of Chicago budget of $5.97 billion because it does not rely on raising property tax and begins the painful yet necessary step of reducing payroll by 2,618 full-time equivalent positions to balance the budget.
October 31, 2007
The Civic Federation opposes the City of Chicago's proposed $5.9 billion budget. The budget proposes an additional $266.6 million in new spending and includes a $108.0 million property tax increase, the largest in recent Chicago history. We believe that the 15.1% property tax increase should be rejected and the city should maintain its self-imposed property tax cap.
November 1, 2006
The Civic Federation supports the City of Chicago's proposed $5.7 billion budget but has serious concerns about the poor health of the City's pension funds and the low level of reserve funds for contingencies.
November 30, 2005
The Civic Federation supported the City's holding the property tax levy constant for the third year in a row and eliminating vacancies, but was concerned by the lack of transparency regarding the funding for operations at Millennium Park, and by the use of borrowing to finance those operations.
December 1, 2004
The Civic Federation supported the City's holding the property tax levy constant for the second year in a row and cutting positions, but was concerned that further measures to control personnel expenditures should be taken and was disappointed that the City did not dedicate more Skyway sale revenues for long-term obligations.
November 5, 2003
The Civic Federation supported Chicago’s FY2004 budget of $4.8 billion because: 1) the City has made continued efforts to control personal services costs by reducing personnel over time; 2) The City’s net appropriation has increased an average of 2.6% per year over the last five years, on par with inflation; and 3) The City did not increase its property tax levy.
DOD audit acronym primer
November 6, 2018
In coming weeks the Department of Defense (DOD) will issue the results of a comprehensive financial statement audit. The effort has been described by Pentagon Comptroller David Norquist as “the largest ever undertaken.”
Defense Department accounting and financial reporting issues have been the principal reason the U.S. Government Accountability Office (GAO) has delivered a disclaimer (flunking) opinion on the consolidated financial statements of the federal government every year for the last two decades.
Trillions of dollars later, we may actually be making some progress in this area, though that is a matter of debate.
For anyone who wants to get up to speed on understanding the issues involved, one of the barriers to an informed debate and discussion is the bewildering array of acronyms and special terms attached to DOD audit issues.
As a small step toward trying to help inform that debate, following is a list of 45 acronyms used to describe various entities, concepts and laws relating to DOD accounting and auditing, together with links to descriptive websites.
For further background on the audit and the reasons why it matters, and remains worth monitoring, see “Auditing the Defense Department: A Primer,” a blog post I wrote back in May.
Best of luck on your mission.
AFR
CAP
CFOA
Chief Financial Officers Act of 1990
CIGIE
Council of the Inspectors General on Integrity and Efficiency
COP-OCO
Comprehensive Oversight Plan -- OCO
CRM
CRS
Congressional Research Service
DCAA
DFAS
Defense Finance and Accounting Services
DHA
DHP
DII
DISA
Defense Information Systems Agency
DLA
DMRDP
Defense Medical Research and Development Program
DOD OIG
Department of Defense Office of Inspector General
ERP
FASAB
Federal Accounting Standards Advisory Board
FCRA
Federal Credit Reform Act of 1990
FFRDC
Federally Funded Research and Development Centers
FIAR
Financial Improvement and Audit Readiness
FMFIA
Federal Managers Financial Integrity Act of 1982
GAGAS
Generally Accepted Government Auditing Standards
GAO
Government Accountability Office
GF
GFEBS
General Fund Enterprise Business Systems
GMRA
Government Management and Reform Act of 1994
IPA
Independent Public Accounting Firm
JFMIP
Joint Financial Management Improvement Program
MHS
MICP
Managers' Internal Control Program
OASDHA
Office of the Assistant Secretary of Defense for Health Affairs
OCO
Overseas Contingency Operations
OMB
Office of Management and Budget
PAR
Performance and Accountability Report
SFFAC
Statements of Federal Financial Accounting Concepts
SFFAS
Statements of Federal Financial Accounting Standards
SIGAR
Special Inspector General for Afghanistan Reconstruction
SRO
USACE
United States Corps of Engineers
USC
USDC
Undersecretary of Defense (Comptroller)
USSGL
USSOCOM
United States Special Operations Command
WCF
Cash is King! Wait a minute …
November 7, 2018
In 1913, on the heels of the then-worst financial crisis in U.S. history, Congress created the Federal Reserve. At the time, the Fed was conceived principally as a ‘lender of last resort,’ a source of liquidity (cash) in the event of widespread bank runs like those that erupted in the Panic of 1907.
Over time, the importance of this beast for the supply of money and credit, and, in turn, interest rates, became increasingly apparent. In the 1977 Federal Reserve Reform Act, Congress developed a directive for the Fed in conducting monetary policy that still exists today.
Section 2A of the Federal Reserve Act is a one-sentence section titled “Monetary Policy Objectives.” It reads:
The Board of Governors of the Federal Reserve System and the Federal Open Market Committee shall maintain long run growth of the monetary and credit aggregates commensurate with the economy's long run potential to increase production, so as to promote effectively the goals of maximum employment, stable prices, and moderate long-term interest rates.
So our Congress, in its infinite wisdom, has seen fit to direct 12 people to control the total amount of money and credit for more than 300 million people.
Faced with such a task, you have to try to count all that stuff up somehow. The Fed has developed accounting for money in its ‘monetary aggregates,’ which are also referred to as measures of the ‘money supply.’
Last week, Steve Hanke of Johns Hopkins University penned an article for Forbes titled “The Fed’s Misleading Money Supply Measures.” Hanke is a monetarist, someone who believes in the central importance of money as a driving force in economic growth and inflation. Hanke thinks money is important, and also thinks that the Fed doesn’t do a good job adding all that stuff up.
In his article, Hanke introduces the work of William Barnett, an economist who has led the development of alternative monetary statistics. In his 2012 book “Getting It Wrong,” Barnett tells the history of his work in this area as an economist at the Federal Reserve Board of Governors, as well as the story of his departure from the Fed.
Barnett makes a case that the Fed wrongly adds different things up at the same weight when accounting for money. The Fed’s narrow M1 aggregate basically includes cash circulating outside of banks as well as demand deposits in bank accounts. From there, the Fed produces (at least historically) progressively broader (and larger) aggregates of money. For example, M2 adds savings deposits and individual savings in money market mutual funds to M1. And the Fed used to report M3, which added other stuff (like institutional money market funds, Eurodollars, repos, and time deposits) to M2.
Barnett’s concern has been that the Fed has been accounting for all these different types of money at equal weights, when different types of money have different degrees of ‘moneyness.’ He has developed statistical measures adjusting different types of money at different weights, and believes they are a more valid representation. Hanke’s summary of his argument is that broader measures of money supply are important, but they should also discount the weight of progressively broader types of ‘money.’
I’m going to argue that this argument should matter, fundamentally, for ‘narrow’ measures of money as well – and in the line item at the top of the balance sheet for companies as well as state and local governments. That line-item is called “Cash and cash equivalents.”
Cash includes two main things – currency circulating outside of banks, and deposits in banks.
And speaking of adding up unequal things at equal weights, consider what people thought of these two things at the time of the Panic of 1907. Did they think they were equal? Far from it. People were panicking! They wanted the good stuff, not the bad stuff.
From there, generally accepted accounting principles enshrined a fundamental falsehood at the top of the balance sheet, inviting decades of government subsidies, interventions, regulations, and bailouts designed (in principle) to try to make these unequal things equal. In turn, these interventions generated moral hazard driving our latest and greatest financial crisis, and continued risk in our financial system today.
Question: If “cash” is not equal to itself, how can “cash equivalents” even exist?
“Cash is King!” they say. Perhaps Cash really is king-like, given that arbitrary tyrannical authority ends up determining if it is really cash or not.
More to follow …
You think you don't own any stocks? Think again
November 12, 2018
The National Public Pension Coalition (NPPC) represents public-sector employees and their interests in retirement benefit plans. On the “About Us” page at its website, the organization states that “NPPC believes every American should be able to retire in dignity. … The NPPC is working to preserve the financial security of all workers for generations to come.”
The NPPC also states that “We also know that there is no one more interested in strengthening the public pension system than the public employees who are counting on pensions to retire.”
Today, Pensions & Investments had a story by Brian Croce headlined “Voters reject candidates in 3 states who lobbied for switch to DC plans.” The article quoted Bridget Early, executive director of the NPCC, “Even when there were attempts to vilify public employees and defined benefit plans and suggestions that everyone should have 401(k)s, I think folks are starting to understand that (retirement security) is very important to the economy.”
Right now, at 1:40pm CT, the Dow is down more than 400 points. Most pension plans are dominated by riskier investments like stocks, real estate, and private equity. Are public pension plan participants concerned?
Maybe not as much as taxpayers or voters are, or should be.
Defined benefit plans offer defined benefits. That’s what makes them safer, on the surface, than 401(k) plans – at least for the people in the plan, especially in public plans in states (like Illinois) where benefits are not only defined but protected by law.
Does that mean these plans aren’t risky? Not for citizens and taxpayers responsible for funding those plans. For those folks, these plans are very risky as they have to make up for any downside.
Retirement security for me, but not for thee.
Should ‘future generations’ care about U.S. government financial trends?
November 14, 2018
Future generations, by definition, don’t exist yet. But ...
If future generations could care about U.S. government finances, would they?
Let’s ask that question the other way around. Should the U.S. government care about future generations?
Whether or not the U.S. government should care, does the US government care about future generations?
Reading the financial report of the federal government, there are some simple cues that the government is at least giving lip service to the idea.
When faced with massive, complex financial statements, either for publicly traded companies or for governments, there are times when simple cues can help inform analysis.
The chart below shows the number of times the term ‘future generations’ is used in the annual financial report of the US government, from 2005 to 2015:
In turn, here’s a chart showing the number of times the word “sustain” appears, either in the term “sustainable,” “unsustainable,” or “sustainability.” These references arise most frequently in discussions on whether and for how long US government finances are sustainable, in light of the implied massive future increases in debt and interest expense under current law, policy, and demographic expectations.
The references to ‘future generations’ and ‘sustain’ have both risen ten-fold since 2005, either because the government really cares more than it used to, or because it thinks it is more important to give lip service to the issues.
Either way, however, this is a bit of a red flag. Anyone who cares about young people, or future generations, or their own future after-tax, after-inflation wealth, should be paying attention to the public purse.
DOD audit report slated to be released today
November 14, 2018
Today, the U.S. Department of Defense will release the results of what has been called the “first-ever department-wide financial audit.”
The Defense Department’s financial statements are actually audited every year. And the failure of the DOD to secure clean, “unmodified” audit opinions have been the principal reason why the Government Accountability Office has delivered a disclaimer of opinion on the overall financial statements of the U.S. Government – every year since the late 1990s.
The new DOD audit initiative does represent a first, however, in how comprehensive it was. The audit will likely provide some valuable new insights and opportunities in improving the trustworthiness of DOD financials.
There will likely be massive media coverage of the release of the report. Looking ahead, here are some questions to consider:
· Which individuals stood out for their leadership and results in improving accounting controls and processes before the audit got underway?
· Who stands out for their performance during the audit, and in applying lessons learned for the future?
· Were any members of Congress helpful in providing feedback and/or valuable oversight during the audit initiative?
· Who have been some of the better reporters covering the issues involved? Either in the mainstream or alternative media? Have any of their insights been especially valuable in the overall effort?
· Which of the independent public accounting firms associated with the audit provided the most valuable service? Did any of them fail to measure up?
· How should the public try to gauge the cost-effectiveness of the money spent on this audit?
· Recent financial market history may provide some valuable perspective. Have you seen the movie “The Big Short?” Have you read the book “The Smartest Guys in the Room?” Have you reflected on the costs and benefits of paying ‘independent’ auditors for their opinions?
· Can or should we measure the success of the audit initiative on the basis of how many scandals were uncovered?
· Can blockchain technology help to address identified weaknesses? What progress is DoD making in this area? Do you see any shortfalls or risks in new accounting technologies for the integrity of the financial reporting process?
· What do these results imply about the cost-effectiveness of the quality of ‘national defense?’ Is there a way to identify what % of current spending levels could achieve equivalent ‘defense,’ holding foreign policy (and the international footprint of ‘national defense’) constant?
· If DoD financial accounts may be ‘modified’ to guard secret classified programs, will DoD ever receive anything but a disclaimer of opinion on its financial statements?
· After reflecting on the audit process, what are some of the strengths and weaknesses of federal government accounting standards? Where could they be improved?
Illinois teachers -- help wanted now
November 20, 2018
I just saw something interesting, and potentially disturbing, on the Illinois Teachers' Retirement System website.
The front page still has a notice that reads:
“A new law addressing Illinois’ teacher shortage problem takes effect with the 2018-2019 school year. Retired TRS members can teach 120 days or 600 hours without affecting their pensions. This change is in effect through the 2019-20 school year.”
In theory, pensions are for retired people, not people earning money while working. Is that how this law works?
Is the 120-day or 600-hour restriction cumulative? Or can teachers teach for 120 days, take some time off, and then start teaching again?
More importantly, what about this “teacher shortage problem?”
Pension funds are financial institutions, like banks and insurance companies. They take money in the door, and put it to work.
Pension funds and insurance companies are a little bit different than banks in one key way: banks can be subject to “run on the bank” issues. If counterparties lose confidence in banks, and withdraw large sums of money, other counterparties may join the party, worried that if they don’t, they will be at the end of the line when nothing is left.
Pensions and insurance companies, however, can be subject to different types of “death spirals” if new money stops coming in the door.
What is happening to the ability to inspire young people to pursue careers as teachers, firefighters and cops in states like Illinois, Connecticut, New Jersey and Kentucky—to name a few—where public pension funds are in very bad shape?
In turn, what is happening to the ability of the pension funds for those employees to depend on future contributions from new and future participants?
Happy Thanksgiving!
Charlotte—an exception to a rule
November 27, 2018
Do finance-heavy cities have governments with relatively strong finances? How about their states?
Consider New York City, Chicago, Hartford, and Charlotte.
New York City, home of the Big Banks and Wall Street. Chicago, with LaSalle Street, banks, insurance companies, and futures and options markets. Hartford, the “insurance capital of the world.”
And Charlotte, now considered the second-largest banking center in the nation.
One might instinctively think that governments in cities with a lot of financial talent and tradition could or should be doing relatively well, themselves, financially.
But that is far from the case.
Truth in Accounting’s analysis of the financial condition of the 75 largest cities ranked Chicago and New York City second-to-last and last, respectively, in terms of their municipal governments’ financial condition. Charlotte ranked No. 4.
While Hartford’s population doesn’t qualify for our annual city report, here’s a look at a related metric (unrestricted net position per capita) in 2010 and the latest fiscal year for New York City, Chicago, Hartford—and for Charlotte.
Reported unrestricted net positions deteriorated significantly, on a per capita basis, for New York City, Chicago, and Hartford, from 2010 to 2017, with significant negative holes in this measure (roughly comparable to shareholder equity, or assets less liabilities, in the private sector).
In government accounting, unrestricted net position helps assess how effectively a jurisdiction has shepherded resources responsibly, avoiding spending beyond current revenues in ways that shift costs to future taxpayers.
On that score, Charlotte is a splendid and shining success, compared to other major financial centers.
And we tend to see the same pattern for the states that are home to these cities.
The chart below shows Truth in Accounting’s rankings for the financial conditions of Connecticut, Delaware, Illinois, New Jersey, New York, and North Carolina. All of these states rank in the bottom 10 of the 50 states—except for North Carolina, which ranks about average among the 50 states.
What is going on here? Why are financially intensive city-states in relatively worse financial shape? What lessons can Charlotte provide?
Page ix (pdf page 13) of Charlotte's latest Strategic Operating Plan, titled "Finance and Budget Principles," could be a good place to start.
How much does FRED cost?
December 5, 2018
Jeffrey Tucker recently wrote an article for the American Institute for Economic Research that examines the costs and benefits of eliminating the Federal Reserve. Tucker contends that the dislocation and transition costs associated with ditching a central bank aren’t as high as one might think. Looking at the services and benefits the Fed assertably provides, Tucker took note of how market forces could deliver those services as well—and perhaps even better—in light of the historical record of the Fed and financial stability.
Among the benefits provided by the Fed, Tucker points out one very interesting service that wouldn’t necessarily go away if the Fed didn’t exist. FRED is an excellent, reliable, massive and consistently updated database of economic, financial and other information that resides on the website of the Federal Reserve Bank of St. Louis. It’s a remarkable resource that’s used by many people in financial markets, the media, and the blogosphere. It is also “free.”
Would FRED disappear if the Fed were eliminated?
In his article, Tucker writes “It’s true that the St. Louis Fed has the best online tool for data reporting but how many people know that this is actually outsourced to a private sector firm?”
If the St. Louis Fed outsources FRED, how much does it pay the vendor(s)?
Consider the market for databases, a market little old Truth in Accounting competes in with our State Data Lab resource. What if we are competing with a wonderful, massive and reliable system such as FRED, which is paid for by an organization that prints money?
If FRED is outsourced, that would help explain why, a couple years ago, when I asked folks at the Federal Reserve Bank of St. Louis how many people were working on this wonderful resource, I was told "That depends on who you ask."
There is no explicit line-item in the financial statements for the St. Louis Fed that specifically identifies FRED. But some clues may be found in the ratio of “other expenses” to salary and benefits expenses, on the one hand, and total operating expenses, on the other hand.
If FRED is outsourced, you might expect to see a higher ratio of “other expenses” to salary and benefits expenses and total operating expenses at the Federal Reserve Bank of St. Louis, compared to other Federal Reserve banks. That is indeed the case.
The charts below show those two ratios for 11 of the 12 reserve banks for the latest year. (They exclude the Federal Reserve Bank of Richmond, which curiously reports significantly negative “other expenses,” a topic of possible future inquiry).
The St. Louis Fed is a huge outlier, with “other expenses” running far higher than the other reserve banks.
Comparing the St. Louis Fed to its in-state colleague Reserve Bank (Kansas City), and crudely assuming the differences in the other expense ratios are explained entirely by FRED, one can make a tentative estimate that FRED costs the Fed $100 million or more, per year.
Not a small chunk of change. And hard to compete with, for organizations that can’t print their own money.
Weed, gambling, COLAs, and more gambling
December 12, 2018
Chicago Mayor Rahm Emanuel today delivered a pension address to the Chicago City Council. At the outset, the mayor reasonably identified some of the sources of the city’s horrible financial condition, including longstanding failures to fund promises distributed to government workers.
“The truth is; going back decades too many elected officials, labor leaders, and civic leaders; people in positions of responsibility; agreed to a funding and benefits system that was not sustainable and therefore not responsible. Some knew it, and others should have known it. Simply put, leaders in the past made commitments without the resources to back them up. And now, inevitably, the bill has come due.”
So, how is the bill going to be paid?
With weed, gambling, COLAs, and more gambling.
Reporting on the pension address, a story in Crain’s was headlined “COLAs, cannabis, casino: It’s Emanuel’s pension Rx.”
Legalizing and taxing marijuana will produce some new revenue for the government, as will expanded gaming. How much, and how much might come at the expense of other existing 'sin tax' revenue sources, remains to be seen. The incremental revenue gains from taxing weed and gaming are certain, however, to fall far short of what is needed to balance the books.
The mayor did say that he would support amending the Illinois Constitution to allow for restructuring agreements with government worker labor unions, with his support specifically for reducing so-called “cost-of-living” increases for government pensions. Here, too, however, the reduced obligations would fall far short of filling the total gap between assets and liabilities in government pension funds.
So what can fill the void?
Granted, headlines have to be short, but the Crain’s headline ““COLAs, cannabis, casino: It’s Emanuel’s pension Rx” was a little too short. It excluded the most significant drug prescribed by the “Good Doctor“– a plan to issue bonds and put the proceeds into the pension funds.
This would undeniably strengthen the city pension funds. It also would undeniably shore up the expectations of city workers that they would be paid.
Would these benefits come from out of nowhere? Or from somebody else’s pockets, like taxpayers?
Effectively, pension obligation bond proposals like this strengthen pension funds at the expense of the entity assuming the risk, and higher leverage, associated with borrowing.
Emanuel asserted ”It is not more debt. It is the same amount of debt, but at a much lower and cheaper cost to taxpayers and the city.”
In a limited but mischievous sense, he is right. The city of Chicago owes money to the pension funds, and to the city’s bondholders. The city could borrow money on a bond offering and deliver the proceeds to the pension fund, replacing the money owed to the pension with more money owed to bondholders.
But in a world where employees and bondholders each share risks from possible government insolvencies, shoring up the employee positions can’t come from out of nowhere.
Weed, gambling, COLAs, and more gambling.
p.s. Crain's isn't alone. The Chicago Tribune's story on the mayor's pension address was headlined "Mayor Emanuel pushes public pension fix to City Council, including legalized marijuana, Chicago casino, constitutional amendment."
A curious lace in the other shoe about to drop on state balance sheets
December 18, 2018
Accounting standards effectively hid the accumulation of massive pension debts from state and local government balance sheets for decades. The pension debts owed to government employees are now being reported as debt. The next shoe to drop will be promises for retiree health care benefits.
You might be surprised how big those health care benefit debts are. Looking across the 50 states, and using the state governments’ own actuarial and accounting assumptions, total unfunded retiree health care obligations run about 80% as high as total unfunded pension obligations. Retiree health care debt actually runs higher than pension debt in 12 of the 50 states.
There’s an interesting if not dramatic characteristic of states that have accumulated relatively high retiree health care debt. It relates to differences between rankings of the 50 states on Truth in Accounting’s (TIA) overall measure of state government financial health (their “Taxpayer Burden”), on the one hand, and rankings of the states on the credit rating published by one of the large credit rating agencies, on the other hand.
Rankings of the states on credit ratings and Taxpayer Burden tend to run in the same direction. But there are good reasons credit ratings and TIA’s Taxpayer Burden can sometimes say very different things. Credit ratings are focused on bondholders, for example, while the Taxpayer Burden is a more holistic view of government financial strength. Credit rating agencies cite the ability of governments to tax as a source of financial strength, but TIA’s Taxpayer Burden measure reflects the fact that the power to tax isn’t necessarily a source of strength for the average taxpaying Joe and Jane. (See this article for a wider discussion of the differences between credit ratings and TIA’s Taxpayer Burden).
Some states have significantly higher rankings on credit ratings than they do on TIA’s Taxpayer Burden. When you rank the states from top to bottom on the difference between their rankings on these two measures, the states at the top of the list are those with stronger credit ratings than what might be expected given TIA’s Taxpayer Burden ranking. And the states at the bottom of the list are those with stronger relative positions for TIA’s Taxpayer Burden than might be expected given their credit rating.
What characterizes the top ten (“Stronger Credit Rating”) states, compared to the bottom ten (“Stronger Taxpayer Burden”) states?
There is at least one dramatic difference between these two groups. The states with “Stronger Credit Ratings” have very high OPEB (retiree health care) debt per taxpayer, compared to the “Stronger Taxpayer Burden” states.
Those “Stronger Credit Rating” states also have higher pension debt per taxpayer, but the difference between the two groups isn’t nearly as dramatic as the difference for OPEB debt per taxpayer.
There are some interesting possible explanations here, among them questions whether OPEB debts have been adequately accounted for – in balance sheets, credit ratings, or bond market prices.
Note: State “#10” over there on the right of the chart is Delaware. See “How can Delaware be a AAA and an F at the same time?”
Movin' on out ...
January 3, 2019
United Van Lines (UVL), one of the largest moving companies in the nation, released its annual National Movers Study on Wednesday. The study ranks the 50 states by the share of total interstate moves out of the state. UVL has conducted this study since 1978, and it has been getting more attention in recent years.
Reporting on the latest results, Newsweek led its story with “New Jersey, Illinois, and Connecticut topped a list of states that saw more residents moving out than arriving from other states in 2018, continuing a trend of people leaving the Northeast and the Midwest for growing cities in the Mountain West and South …”
Coincidentally, or not, New Jersey, Illinois, and Connecticut are also the three lowest-ranking states in the nation based on Truth in Accounting’s “Taxpayer Burden” measure of state governments’ financial condition.
How important are state government finances for recent migration trends? What are some other factors that can explain those trends?
United Van Lines identified the Top 10 states with the highest net inbound moves as Arizona, Idaho, Nevada, North Carolina, Oregon, South Carolina, South Dakota, Vermont, Washington, and the District of Columbia.
The Top 10 states with the most outbound moves were (alphabetically) Connecticut, Illinois, Iowa, Kansas, Massachusetts, Michigan, Montana, New Jersey, New York, and Ohio.
These two groups of states differ from each other on some very interesting dimensions (we are going to exclude DC in this analysis). Using Truth in Accounting’s State Data Lab, we can rank the states on a wide variety of other characteristics, and compare these two groups of “in-migration” and “out-migration” states.
Comparing the average rankings for these two groups, some of the significant differences (ranked from lowest to highest in terms of significance) include:
1. Cost of Living: Out-migration states have higher cost-of-living rankings, using regional price parity statistics.
2. Doctors Accepting New Medicaid Patients: Out-migration states rank lower on the share of doctors accepting new Medicaid patients. States in bad financial condition tend to have fewer doctors accepting new Medicaid patients.
3. Winter Average Temperature: Out-migration states tend to rank lower (colder) for average winter temperatures.
4. Trust in State Government: Out-migration states rank significantly lower than in-migration states in the latest Gallup poll on trust in state government.
5. Taxpayer Burden (TIA): Out-migration states rank significantly lower (worse) on Truth in Accounting’s “Taxpayer Burden” measure of state financial condition.
6. Collective Bargaining in the Public Sector: Out-migration states rank significantly higher for the share of government employees covered by collective bargaining agreements.
7. Taxpayer Burden (WalletHub): Out-migration states rank significantly higher on the share of income consumed by taxes, a different measure of “taxpayer burden” calculated by WalletHub.
8. Balanced Budgets: Out-migration states rank significantly lower in terms of how frequently they keep accrual expenses below revenue on an annual basis since 2005. Conversely, in-migration states do a significantly better job of meeting balanced budget requirements. They also rank higher on trust in state government.
9. Lawyers per 10,000 Residents. In the most significant difference among these 9 indicators, out-migration states rank significantly higher on the number of lawyers per capita.
So, how does Illinois fare in all of this? As noted, Illinois ranked second worst out of the 50 states for out-migration in 2018, at least by UVL’s count..
In turn, the table below reports Illinois’ ranking on all nine of the above measures out of the 50 states.
1. Doctors Accepting New Medicaid Patients (30)
2. Winter Average Temperature (31)
3. Cost of Living (33)
4. Collective Bargaining in the Public Sector (38)
5. Wallethub's taxpayer burden (43)
6. Lawyers per 10,000 Residents (46)
7. TIA's Taxpayer Burden (48)
8. Balanced Budgets (49)
9. Trust in State Government (50)
Illinois, one of the highest out-migration states in the nation, ranked third-to-last, second-to-last, and last, respectively, in Truth in Accounting’s Taxpayer Burden indicator, how frequently the state truly balanced its budget since 2005, and trust in state government.
Perhaps some lessons may be learned in all of this, particularly in light of today’s news that the longest-serving member of the Chicago City Council and the chairman of the Council’s Finance Committee has been indicted on federal corruption charges
Fewer babies arriving in Illinois
January 10, 2019
Recent news about population trends in Illinois haven’t been good. Private-sector reports like United Van Lines’ annual National Movers Study and public sector data have indicated Illinois ranks as a national leader in outmigration. And late last year, the Census Bureau’s annual population report showed that Illinois population fell for the fifth consecutive year, with the rate of decline accelerating.
Migration trends are one factor in population growth, but “new entrants” also matter. The chart below is drawn from Truth in Accounting’s State Data Lab website, and shows Illinois’ fertility rate from 2010 to 2016.
Across the 50 states, interstate migration trends in recent years are significantly associated with state government financial conditions, and Truth in Accounting’s “Taxpayer Burden” measure of fiscal health. A closer look at fertility rates indicates an even stronger association with state finances. States in bad fiscal health rank low on fertility.
If you were a baby, would you rather come into the world with a low taxpayer burden, or a higher one?
DOD audit results: Some questions for the powers that be
January 11, 2019
Can you please identify individuals that stood out for their effort, leadership, and results in improving accounting controls and processes this past year? What can others learn from them?
Can you please identify any members of Congress that were helpful in providing feedback and/or valuable oversight during the new audit initiative?
Who have been some of the better reporters covering the issues involved? Either in the mainstream or alternative media? Have any of their insights been especially valuable in the overall effort?
Which of the independent public accounting firms associated with the audit provided the most valuable service? Did any of them fail to measure up?
How should the public try to gauge the cost-effectiveness of the money spent on this audit?
Can blockchain technology help to address identified weaknesses? What progress is DoD making in this area? Do you see any shortfalls or risks in new accounting technologies for the integrity of the financial reporting process?
Recent financial market history may provide some valuable perspective. Have you seen the movie “The Big Short?” Have you read the book “The Smartest Guys in the Room?” Have you reflected on the costs and benefits of paying ‘independent’ auditors for their opinions?
Can or should we measure the success of the audit initiative on the basis of how many scandals were uncovered?
What do these results imply about the cost-effectiveness of the quality of ‘national defense?’ Is there a way to identify what % of current spending levels could achieve equivalent ‘defense,’ holding foreign policy (and the international footprint of ‘national defense’) constant?
If DoD financial accounts may be ‘modified’ to guard secret classified programs, will DoD ever receive anything but a disclaimer of opinion on its financial statements?
The Federal Reserve rewrites the Federal Reserve Reform Act
January 11, 2019
The Federal Reserve is an ‘independent’ entity, but it still takes its marching orders from the Congress, and the law.
The modern directive for the Federal Reserve for conducting monetary policy arrived in the Federal Reserve Reform Act of 1977. In language that still exists in federal law, that legislation established objectives in the following terms:
“The Board of Governors of the Federal Reserve System and the Federal Open Market Committee shall maintain long run growth of the monetary and credit aggregates commensurate with the economy's long run potential to increase production, so as to promote effectively the goals of maximum employment, stable prices, and moderate long-term interest rates.”
For good or ill, the Congress told a few people to control the total amount of money and credit for more than 200 million people.
In making that grant of authority, Congress directed the Fed to maintain the “long run growth” of money and credit, in light the economy’s “long run potential.”
Yesterday, in an interview at the Economic Club of Washington D.C., Federal Reserve Board Chairman Jerome Powell was asked if he was worried, at the Fed, about “the enormous amount of debt the Federal Government has.”
Powell’s response included:
"I'm very worried about it. From the Fed's standpoint, we're really looking at a business cycle length: that's our frame of reference. The long-run fiscal, nonsustainability of the U.S. federal government isn't really something that plays into the medium term that is relevant for our policy decisions. It's a long-run issue that we definitely need to face, and ultimately, will have no choice but to face," he added.”
Maybe this is just an Artful Dodger way to avoid getting into the fiscal policy mud.
But Congress told the Fed to be concerned with the long run. So much for the directive to maintain the “long run growth” of money and credit, in light of the economy’s “long run potential.” The Fed has decided that it’s the “medium term,” whatever that means, that is relevant for its policy decisions.
The long-run issue of federal government debt could turn into a medium term issue sooner than later – perhaps even soon.
Illinois needs a constitutional amendment to defuse a ticking retirement time bomb
David Walker | January 16, 2019
By David Walker, former U.S. Comptroller General
The State of Illinois must amend its Constitution to address the serious unfunded pension and retiree health care challenges facing the state and the City of Chicago. The Employee Retirement Income Security Act of 1974 (ERISA) should be basis for the Amendment.
The Illinois Supreme Court has issued two decisions regarding the ability of the State of Illinois and the City of Chicago to amend their current pension plans and retiree health care arrangements. Those decisions were based on the Court’s interpretation of wording in the 1970 Illinois Constitution which states that retirement benefits “shall not be diminished or impaired”. These decisions were unprecedented and unduly restrictive since they do not allow for the type of reasonable reforms that can be achieved in the private and non-profit sectors under ERISA.
Several key facts are clear. First, the State of Illinois and City of Chicago are in poor financial condition. For example, the Chicago based Institute for Truth in Accounting (TIA) recently rated Illinois #48 of the 50 states in financial condition. TIA has also rated the City of Chicago poorly in both financial position and transparency.
Second, both the state and the city have huge unfunded pension and retiree health care obligations. The related current costs are already having an adverse impact on the ability of the state and the city to fund education, critical infrastructure and other key public services. Absent reform, these adverse impacts will grow thereby increasing pressure for future tax increases at both the state and city level.
Third, the Illinois Constitutional provision predates enactment of ERISA. That federal law was the result of many years of discussion and debate involving employers, unions, citizen rights groups and a variety of other parties. It was designed to create reasonable and sustainable pension protections in light of several large company failures and pension abuses.
Finally, both Illinois and Chicago need to reform their existing retirement plans in a reasonable, affordable and sustainable manner. Doing so will require a state Constitutional Amendment.
It would seem that the most prudent and equitable course of action would be to pursue an Amendment that is based on ERISA’s framework. Such a framework would prevent an involuntary reduction of a pension benefit based on service rendered to-date but would allow for reductions or caps in future benefit accruals and cost of living adjustments (COLAs) to such future accruals. In addition, it would also require certain minimum funding standards to provide reasonable assurance that promised benefits will be paid. Importantly, under ERISA, retiree health care arrangements are not deemed to be retirement plans. As a result, needed changes can be made to make them more affordable and sustainable over time.
It’s time to recognize reality. Illinois and Chicago face serious financial and competitiveness challenges that cannot be effectively addressed without restructuring current pension plans and retiree health care arrangements. A state Constitutional Amendment is needed to make that happen and it should be pursued on a high priority basis. Using ERISA as a model for such an Amendment is an appropriate, equitable and effective way to proceed.
Ye of little faith ...
January 16, 2019
Here are the number of times the words “tax,” “budget,” “grow,” “spend,” “reduce,” “borrow,” “save,” “debt,” “accounting,” “financial,” “corrupt,” “trust” and “faith” appear in the text of the inauguration address by the new Governor of Illinois.
The first reference to ‘faith’ arrives in a story about Reverend Robert Collyer, the pastor of a church destroyed in the Great Chicago Fire, followed by the Governor’s call today to “reaffirm our faith in one another.”
The second reference to ‘faith’ arrives in the Governor’s call to enter a discussion about the state’s budget and tax system “in good faith.”
The third reference to ‘faith’ arrives in the Governor’s call for building a future of “boundless opportunity,” revisiting the image of Reverend Collyer and calling for us to remember Reverend Collyer “when your faith in this future flags.”
The last two references to ‘faith’ arrive in the Governor’s (not Reverend’s) closing sentences:
“So thank you, Illinois, for your faith in me. I promise to live up to it every day. Together let’s go into this new century with enough faith to help each other out of our troubles, with enough foolishness to believe we can make a difference in the world, and with enough kindness to find the courage to change. Thank you. God bless the state of Illinois. And God bless the United States of America.”
If you can’t count improper government payments, does that make them proper?
January 23, 2019
The American Institute for Economic Research recently published an article by Veronique de Rugy titled “How $137 Billion Strangely Disappears.” de Rugy described a new report on the government’s ‘improper payments’ problem, one factor underlying the GAO’s annual disclaimer of opinion on the financial statements in the Financial Report of the U.S. Government.
The report de Rugy covered has been produced since an executive order was issued by President Obama in 2009. Under this order, the U.S. Department of the Treasury (together with the Justice Department and the Office of Management and Budget, also in the executive branch) established a website called PaymentAccuracy.gov. The site lists 12 “high-priority” areas with improper payments estimates running $2 billion or more. Medicare and Medicaid lead the way, with their estimated improper payments totaling more than $80 billion a year.
In her article, de Rugy openly admits she would peg the number much higher, at least under her interpretation of the ‘proper’ role of government. But as a matter of law, determining what is or isn’t proper under the terms of government programs isn’t always an easy thing to estimate.
de Rugy takes note how the list provided in the PaymentAccuracy.gov website is dominated by social insurance / welfare programs, raising an interesting question or two that she didn’t discuss. Is the Defense Department deemed a High-Priority area? Not for the purposes of the high-priority list, at least the list provided by the Executive Branch. Their list includes 12 areas, but DOD isn’t in there (although two VA programs are there, counting for $10 billion of the $137 billion).
What is an ‘improper payment,’ anyway? And who decides?
In citing improper payments as a material weakness in federal government financial reporting, the GAO (the audit arm of Congress, not the executive branch) stated in its latest opinion letter (for 2017) that “the federal government is unable to determine the full extent to which improper payments occur …” In previous years, the Financial Report of the U.S. Government had provided a government-wide estimate of improper payments, based on estimates provided by departments that actually reported those estimates. But the annual report did not make a government-wide estimate for the first time in 2017, which may actually be a valuable admission that it could not determine the full extent to which improper payments occur.
Are there no improper payments in the Department of Defense?
In its 2017 opinion letter, the GAO took note that the DOD Inspector General stated that DOD “did not ensure that all improper payments were included in certain programs’ improper payment estimates, and as a result, the DOD published unreliable estimates of improper payments for fiscal year 2016” -- for 2016, not 2017.
In a recent report explaining the results of the comprehensive new audit undertaken in the last year, the DOD Inspector General listed “Financial Management Systems and Information and Technology” at the top of the of 20 identified material weaknesses leading to the disclaimer of opinion on DOD financial statements, noting specifically that “Ineffective IT system controls can also result in significant risk to DOD operations and assets. For example, payments and collections could be lost, stolen, or duplicated as a result of weak IT controls.”
Commenting on results of a review last year, Peter Tyler of the Project on Government Oversight put it more bluntly. “Along with the Pentagon needing to work harder to reduce improper payments, we see the IG report as being too polite. … The reported DOD improper payments numbers are highly suspect.”
That $137 billion could indeed be a lowball estimate, no matter how you feel about the appropriate scale and scope of government.
Why are Climate Alliance governors in states with bad financial conditions?
January 23, 2019
New Illinois Gov. JB Pritzker issued an executive order today making the governor a member of the U.S. Climate Alliance. This is a coalition of state governors committed to the provisions of the Paris Climate Agreement.
A press release stated that his participation “commits the state to the principles of the Paris Climate Agreement in order to protect Illinoisans from the damaging effects of climate change.” The press release also noted that this action made Pritzker the 18th governor to join the alliance.
The website for the U.S. Climate Alliance has an “about us” page that shows the official state seals for the states with governors who have joined the alliance. It also has a page showing the individual governors. In listing the “Alliance Principles,” the website calls the alliance “a bipartisan coalition of governors committed to reducing greenhouse gas emissions consistent with the goals of the Paris Agreement.” It also claims that member states, not just governors, commit to those goals.
That latter claim may be tested in individual state legislatures. This is a coalition of governors, despite the fact that the alliance website’s “about us” page shows state seals, not state governors.
Last November, Inside Climate News posted an article by Marianne Lavelle titled, “A Carbon Tax Wave? 7 States Considering Carbon Pricing to Fight Climate Change.” The article listed 15 states that either had or were considering “carbon pricing.” The article noted that those states shared two common traits—“relatively low-carbon economies” and “clear, pressing economic and human risks from climate change.”
Taking a look at the list of those 15 states, they share another common trait. They tend to be in very bad financial shape, compared to the other states of the Union.
The 15 states that Inside Climate News article identified included California, New York, New Jersey, Connecticut, Virginia, Washington, Massachusetts, Maryland, Oregon, Hawaii, New Hampshire, Maine, Vermont, Rhode Island, and Delaware. Adding Illinois to that list, the average per-Taxpayer Burden calculated by Truth in Accounting for these states runs almost $24,000—more than four times the average for the other 35 states.
And the average per-Taxpayer Burden for those first 15 states has worsened since 2009, despite the economic and financial market recovery. For the other 35 states, the average per-Taxpayer Burden has been basically unchanged.
Is it possible that state governors in the U.S. Climate Alliance also really care about ways to get money in the door?
Bad math in Chicago Public Schools' 'surplus'
January 24, 2019
The Chicago Sun-Times reported today on the release of CPS’ annual financial report. The headline was “CPS finishes year with surplus as CTU talks get going.”
Sun-Times education reporter Mitchell Armentrout wrote that CPS administrators “offered some rare positive news,” as the year ended with $324 million “left over in CPS’s general operating fund.” Armentrout included favorable impressions offered by the CPS controller, the Chicago Teachers Union president, and the president of the Chicago Board of Education. Armentrout did not cite any independent outsiders in his article.
The article and its official sources paint a picture of improving finances, based on the surplus reported for the CPS general operating fund at fiscal year-end (June 30, not December 31, 2018).
A “surplus” sounds like they have more than they need, right?
Unfortunately, government officials long have anchored their communications to the public using unreliable and deceptive cash-based accounting results. Longer story short, one way to improve your “cash” position (and general operating fund balance), in the short-run, anyway, is to run up your credit card.
Where have CPS’ finances been heading, based on more reliable accrual-based accounting?
Those results are to be found not in the statements for the general operating fund, but earlier, in the two main (and first-presented) financial statements, which go unmentioned in Armentrout’s article. They are the Statement of Net Position and Statement of Activities, which can be found on pages 44-46 in the CPS annual report here.
The Statement of Net Position takes a balance sheet, point-in-time perspective. It’s basically a “what you have, minus what you owe, is what is left over” framework, showing assets, liabilities, and net position (assets minus liabilities). Some assets are restricted for specific uses, however, and a better bottom-line measure to watch is the “unrestricted net position” (similar to shareholder equity in the private sector).
Here’s what that looks like for CPS over the last decade, through 2018.
Did CPS finances improve last year? Does it look like it ended with a ‘surplus?’
That massive drop in 2015 arrived because these statements, which are better to watch than the funds statements used and abused by political messaging, aren’t always based on reliable accounting standards, either. In 2015, CPS (and other state and local government entities) finally recognized pension liabilities as debt on their balance sheet, making what was ‘left over’ (which was already negative) look even worse. The important point for now, however, is that this unrestricted net position has consistently deteriorated in recent years.
The Statement of Activities is the next statement presented. It is based on income statement framework, covering a period of time, not a point in time. It also produces a "what is left over" result, however. After adding up revenues, it subtracts expenses, leading to a bottom-line called "Change in Net Position" (like net income, for private sector companies). Here’s a look at the annual change in net position reported for CPS in the last decade.
CPS lost money every year from 2009 to 2018, with red ink totaling more than $7 billion over that time frame. Things improved in 2018, but only in a very narrow sense—CPS lost less money than it did the year before. But an $800 million shortfall is not good news.
One way to cut through the complexity underlying these statements is to focus on interest expense—the cost of borrowing money. CPS has filled the massive gap in expenses over revenue by borrowing lots and lots of money—from its workers, in the form of unfunded retirement promises, and from anyone willing to buy lots and lots of bonds.
General market interest rates have fallen significantly since 2009. Other things equal, that should lead to a lower interest burden for CPS, right? Here’s interest expense reported on the Statement of Activities for CPS since 2009:
Interest expense rose steadily from about $200 million in 2009 to $300 million in 2016, and then spiked higher in 2017 to 2018.
Is this a picture of improving financial conditions?
Chicago Board of Education President Frank Clark wrote a letter introducing the report, in which he cited the recent development of a “more equitable funding formula adopted by the state,” which “has allowed CPS to achieve improved financial stability.” That financial stability has yet to appear in CPS’ overall financial results, however -- the same results he stated the Board was pleased to present. He also stated:
“The more equitable funding formula adopted by the state has resulted in hundreds of millions of dollars in additional resources for students with the potential for additional resources that would bring CPS closer to funding equity if fully funded.”
The potential for additional resources aren’t resources—they are potential resources. And the “if” preceding the “fully funded” at the end of the sentence above may be a big if.
Nonetheless, Clark goes on to say “These additional funds are supporting our vision for the future of Chicago Public Schools”—as if these funds exist today, in the present tense.
Citizens and taxpayers have to do their own homework. They can’t take communications by government officials—and reporting in mainstream media—at face value.
Next week’s State of the Union Address – should we expect financial results?
January 29, 2019
President Donald Trump will deliver a State of the Union Address next Tuesday, Feb. 5. Nancy Pelosi, who, as Speaker of the House of Representatives, “invites” the President, had earlier postponed the address amidst the partial government shutdown.
What will we learn about the state of our government’s finances during the Address?
The State of the Union isn’t the only thing delayed by the shutdown, unfortunately.
The government has also delayed the release of the annual Financial Report of the U.S. Government, given the effects of the shutdown on the financial reporting process.
This seems to imply, with the shutdown affecting “non-essential” employees, a critical safeguard for securing government financial accountability is not an essential document.
So this year, the President will be informing us about the State of the Union, as required by the Constitution -- but he won’t be doing it based on the results of an audited financial report for the last fiscal year.
How can you give a State of the Union Address without a financial report?
Sadly, this isn’t exactly a one-time thing. Four of the last five State of the Unions were delivered before, not after, the relevant recent financial report was made available.
Going forward, it would seem reasonable to request the legislative and executive branches arrange the State of the Union Address to be delivered after, and based importantly on, the audited Financial Report of the U.S. Government.
That way, we might, after more than 200 years, actually start living up to another safeguard advertised to us in our Constitution – the Statement and Account Clause.
How much does DoD’s Annual Financial Report cost?
February 18, 2019
In late 2018, the United States Department of Defense (DoD) released its annual financial report, including audited financial statements.
The DoD’s financial statements help us understand how much the DoD costs, in theory. But how much does it cost to produce those financial statements, and the annual financial report itself?
One place to look is at the front of that report, On the page titled “About the Department of Defense Agency Financial Report,” there is a box at the bottom with a disclosure that reads:
"The estimated cost of this report or study for the Department of Defense is approximately $324,000 in Fiscal Years 2018 – 2019. This includes $149,000 in expenses and $175,000 in DoD labor."
Three hundred grand? For what? The ink in the report, and for people to drive trucks delivering the hard copies?
Last year, the DoD underwent its first “full financial statement audit,” after DoD leaders first asserted they were “audit ready.” DoD auditors and private accounting firms conducted a massive financial and accounting exploration mission, leading to more than 2,000 notices of findings and recommendations for weaknesses in DoD accounting practices and financial controls -- and ultimately, another disclaimer (flunk) audit opinion for the financial statements included in the Agency Financial Report.
Conducting the audit and addressing the identified issues has been estimated to cost as much as $1 billion.
Granted, this may be a little nitpicky. But the “cost of this report or study" isn’t so cheap.
New Illinois governor, old claim to “balanced budget”
February 21, 2019
New Illinois Governor J.B. Pritzker proposed his first budget to the Illinois General Assembly yesterday.
When considering the implications of budgets and budget speeches, it makes sense to step back and reflect on some of the risks of applying cosmetics in the world of public finance.
In recent decades, Illinois and Chicago politicians have regularly claimed to “balance the budget,” citing legal requirements. For the state of Illinois, the requirement is often said to be rooted in the state constitution. For the city of Chicago, the requirement cited is a state law.
Trouble is, Illinois and Chicago regularly spend a lot more money than they take in, borrowing to make up the difference, and all the while claiming to balance the budget.
Today, in his budget messaging, it was more of the same from Pritzker. Turning over a new leaf we are not.
In the opening sentences of the “Reader’s Guide” to the Governor’s proposed operating budget, we are told the following:
“The Illinois Constitution requires the Governor to submit a balanced budget and imposes the duty to pass a balanced budget on the General Assembly.”
And in his prepared remarks (which included the word “honest” six times), the new Governor assured us:
“To that end, the budget I present to you today is an honest proposal – the costs are not hidden, the revenues I propose are not out of reach, the hole we need to fill is not ignored. … I want to be clear about this … this Fiscal Year 2020 budget is balanced, but that’s not enough. This is only Year One of a multi-year endeavor …”
Trouble is, the language of the relevant provisions in the Illinois Constitution don’t use the word “balanced.” Here’s the relevant sentence, through which you can drive several trucks loaded with debt bombs:
“Proposed expenditures shall not exceed funds estimated to be available for the fiscal year as shown in the budget.”
“Proposed expenditures” are not actual expenses. And “funds estimated to be available” are not revenue. Expenditures are a cash-accounting artifact that may not include expenses accrued by distributing unfunded promises to pay money in the future. And “funds estimated to be available” can include money anticipated from asset sales, as well as borrowing proceeds.
Since 2005, Illinois has been among the worst states in the nation in walking the talk on its “balanced budgets,” keeping accrued expenses below revenue in only three of those thirteen years.
It’s hard to be optimistic that Illinois will improve on that record in the years ahead.
Budgets can serve as vehicles for planning, control and accountability. But at the end of the day, budgets are basically forward-looking rhetorical devices. Budgets are not results. Every year, we get a chance to ask, and answer, the question – did they really walk the talk?
There are words, and there are deeds. Budgets are words. Audited financial statements help us understand the deeds.
So, what do we know now, about the real results so far? Illinois’ governor proposed a budget for fiscal 2020, but the latest year for which we have audited financial statements is fiscal year 2017 – a year that ended more than 600 days ago!
Some states are especially keen on a popular vote for U.S. President
March 4, 2019
Last week, Colorado became the latest state to pass legislation and join the National Popular Vote Interstate Compact.
This initiative aims to eliminate state-by-state “winner-take-all” counting for electoral votes. In the words of the National Popular Vote Inc., a nonprofit organizer for the initiative, the system would “guarantee the Presidency to the candidate who receives the most popular votes in all 50 states and the District of Columbia.”
Curiously, the initiative would not eliminate the Electoral College itself.
Together with Colorado, the other states in the Popular Vote Compact include California, Connecticut, Hawaii, Maine, Maryland, New Jersey, New York, Rhode Island, Vermont, and Washington.
Truth in Accounting’s “Taxpayer Burden” measure provides a snapshot of the fiscal condition of state and local governments, including all unfunded debt on a per-taxpayer basis. Truth in Accounting calculates a Taxpayer Burden averaging $24,000 for the 11 states in the Compact -- more than four times as high as the average Taxpayer Burden for the other 39 states in the Union.
And the average Taxpayer Burden for the Popular Vote Compact states has deteriorated 35% since 2009, in contrast to modest improvement, on average, elsewhere throughout the Union.
Hmm.
Here’s one way to reflect on the motivations for the popular vote initiative: there are also movements afoot in some states to enact a balanced budget amendment in the U.S. Constitution. As a general rule, states that have “signed on” to that initiative tend to be in much better shape, financially, than the states that haven’t.
In the vote for President, the current system has a floor of 3 electoral votes per state, regardless of population. And states with few electoral votes tend to be in better shape, financially, than states with lots of electoral votes.
Is it possible that states are voting with their wallets? Especially relating to any possible federal bailout for states in bad financial condition?
(Note: The image at the top of this article is a certificate for the electoral vote for Louisiana for Rutherford B. Hayes in the Tilden v. Hayes presidential election in 1876. See "The Disputed Election of 1876")
How big is Illinois’ balance sheet?
March 8, 2019
A question like this is normally a no-brainer. You look at total assets, report what they say, and move on.
In government accounting, however, “normal” can get pretty strange. Especially in Illinois.
Here’s a link to Illinois’ latest Comprehensive Annual Financial Report (CAFR). You can see the balance sheet (the “Statement of Net Position”) on page 32.
It’s worth noting the date on the latest balance sheet. It is June 30, 2017.
So we really don’t know how big Illinois’ balance sheet is right now. The latest date for which we have audited financial statements with a balance sheet was 616 days ago.
The Illinois CAFR is prepared in the office of the Illinois Comptroller. In November 2018, Susana Mendoza won the election for the Illinois Comptroller. Eight days later, she announced she would be running for Mayor of Chicago. She lost in that election, in late February 2019.
The Comptroller has clearly been busy in recent months, but maybe the financial reporting process wasn’t as high on the agenda as normal, or at least on her agenda. Last year, Illinois’ CAFR was dated March 15. It will be interesting to see how long it takes the Comptroller’s office to deliver the report this year.
So how about that 616-day-old balance sheet? The first page includes the reported assets, for both the primary government and the component units. Within primary government, amounts are reported for Governmental Activities and Business-Type Activities, leading to total assets of $54.3 billion for the primary government.
Component units are also important in government financials. They are legally separate organizations for which the primary government is financially accountable, such as state universities. Adding the assets of Illinois’ component units to those of the primary government gets you another $27.8 billion, for total assets of $82.1 billion.
Normally, balance sheets include assets, liabilities, and net position. Assets minus liabilities leaves you with a net position. But take a closer look at the Illinois balance sheet, at the stuff right below the assets.
That’s when things get really strange. That’s the section titled “Deferred Outflows of Resources.”
What does “Deferred Outflows of Resources” sound like to you? Are they a good thing, or a bad thing?
These puppies first arrived in state and local government balance sheets in 2010. Back in the mid-2000s, some state and local governments, concerned about the risks of refinancing debt down the road if interest rates were to increase, began to enter into interest rate swaps -- derivative transactions -- with financial institutions. These swap deals would have paid governments if interest rates rose, offsetting the costs of refinancing at higher rates.
Trouble is, interest rates began to fall over coming years, leading in some cases (like the City of Chicago and the State of Illinois) to massive liabilities for losses on these transactions.
These liabilities weren’t on the balance sheet until 2010, when they were finally recognized. It took the Governmental Accounting Standards Board about a decade longer than the Federal Accounting Standards Board to require recognition of over-the-counter derivative positions in the financial statements.
In accounting, there are debits and credits. When you recognize a liability, you credit the account. But in the dual-entry system, every credit has a related debit, and vice versa.
In Accounting 101, they taught us that when you recognize a liability you previously didn’t acknowledge, the offsetting debit is a loss, one that hits the income statement and, in turn, the net position.
But that’s not what GASB did on those swaps losses.
Instead, the new “Deferred Outflows of Resources” concept was born. The offsetting debit (in Chicago and Illinois) for hundreds of millions of dollars of liability arrived in that section of the balance sheet.
These deferred outflows are added to the assets in calculating the net position! Therefore, they insulate the reported net position from taking a hit from the hundreds of millions of dollars in new liabilities recognized on the swaps.
If governments hadn’t entered into these swap arrangements, they would have been better off, so this appears like an overly creative way to avoid reporting a loss. There may be a good reason for this accounting treatment, but I haven’t seen it explained well yet.
How about the latest Illinois balance sheet? How big are those deferred outflows of resources? What exactly is in that stuff?
Keep looking down the balance sheet on page 32. Below total assets lies the “deferred outflows of resources” section. Looking at the primary government total, what do you see?
In addition to the $54.3 billion in total assets in the upper section, there is another $26.6 billion in deferred outflows! They are more than half of total assets!
And the biggest line item in there? “Deferred outflows of resources – pensions.”
That $26.6 billion is added to the $54.3 billion in assets, before subtracting liabilities (and deferred inflows), to get to the net position.
So it sounds like that $26.6 billion must be a good thing, right?
Let’s look at the balance sheet for the previous year. It is also on page 32. That year, there were only $12.2 billion of these “good things.” Deferred outflows of resources then doubled in 2017.
What happened? Why did the deferred outflows double? That must be a good thing, if they are added to the assets, right?
From 2016 to 2017, Illinois’ reported net pension liability went from $116.0 billion to $137.7 billion. That’s not a good thing, right? Why did it go up so much?
And speaking of what do we know and when do we know it, note that state and local governments are allowed to choose the current year or the prior fiscal year, when reporting the pension valuations and related liabilities. The Illinois June 30, 2017 balance sheet relies on a June 30, 2016 pension valuation.
One reason Illinois’ reported net pension liability went up so much in fiscal 2017 (based on the fiscal 2016 valuation) is that the pension plans changed the assumptions on which they rely for estimating the pension liability. This means they either realized or confessed that they had been low-balling the liability.
When they fessed up, the liability got bigger. And the “deferred outflows of resources” got bigger too, effectively insulating the net position from a big hit that otherwise would have arrived given the larger pension liability. The impact of those changes in assumptions are then smoothed in, over time, for the income statement and balance sheet.
What do you think? Should governments be allowed to smooth their reported results like this?
Here’s a look at the total deferred outflows of resources reported by Illinois and neighboring states in fiscal 2017.
So, what do you think? Is the Illinois balance sheet as big as total assets, or as big as total assets plus deferred outflows of resources?
Having fun yet? Welcome to world of securing government financial accountability.
Do teacher pension plans boost the Illinois economy?
March 12, 2019
The Teachers’ Retirement System of the State of Illinois (TRS) administers a defined benefit pension plan for public school teachers. It’s a massive beast, with about $50 billion in invested assets for more than 400,000 members and benefit recipients.
Fifty billion dollars may sound like a lot of dough, but the TRS plan is woefully underfunded. At the end of fiscal year 2017, the plan reported having just 40 percent of the assets needed to cover a present value liability of $127 billion.
Amidst growing angst in Illinois about government financial conditions, and a rising tide of outmigration, take a peek at the item at the top of the front page of the TRS website today. It links to a recent press release titled “TRS Members Boost Economy By $16.1 Billion Annually.”
Why would an upside-down pension plan be advertising its broader social value in such a prominent way? What if the claims to social benefits are flawed? Should they be the basis of public policy?
Consider in turn that many of the teachers who are TRS members are also teaching kids about economics, finance, and government policy.
For economic impact studies, you have to consider the source. Here, the TRS is reporting on its own study of its own economic impact on the state. Is it possible that those benefits are overstated in the interest of TRS members?
Like a wide variety of other agenda-driven economic impact studies, TRS starts with payments of salaries and benefits to active and retired members. From there, it applies formulas that theoretically calculate economic stimulus, in part using “multipliers” for spending by the firms and people that received money from the teachers and pensioners spending their money.
The TRS states that it uses net, not gross payments, subtracting taxes from gross payments to active and retired teachers “to be more conservative.” But there is a bigger reason to be more conservative, if not more accurate.
Where did the money paid to teachers in salaries and benefits come from?
Consider the argument in an article by Roy Cordato at the John Locke Foundation titled “Economic Impact Studies: The Missing Ingredient is Economics.” Cordato identifies a key flaw in many of these studies: they don’t account for opportunity cost, one of the most fundamental concepts of economics:
Every dollar that is spent as these “impacts” occur and every resource that is used, including labor, has an unseen opportunity cost. … What economic activities would have occurred if that money remained in the hands of the taxpayer?
The State of Illinois and the City of Chicago are fiscal disasters. The prospects for government services and future tax policy changes are driving significant outmigration. Claims that TRS or other pension plans “boost” the economy deserve close scrutiny -- and skepticism.
Budgeting for terrorism
March 14, 2019
Did you know you are effectively a shareholder in a massive insurance company? Did you know that this company insures insurance companies? And for losses from terrorism?
Our federal government runs a variety of insurance programs, and undertakes risk like an insurer does in a variety of indirect ways. In fact, Uncle Sam can be considered the largest insurance company in world history, with accounting challenges (and issues) to match.
One formal program was created in 2002. The Terrorism Risk Insurance Program (TRIP), in the United States Treasury Department, provides reinsurance for private insurance companies exposed to losses from acts of terrorism.
Like any federal program requiring funding, this program requires budget authority.
How much? How has that number been moving in recent years? What does it look like in the President’s budget released earlier this week?
Last we looked (for 2017), the trend in budget authority looked a little scary.
But the good news, seemingly, is a) we haven’t had a significant terrorism loss event since that FY 2017 budget, and b) the amount of budget authority, while still anticipated to grow through FY 2020, has been decreasing in the last two years.
The chart below takes the last three fiscal years for which budget authority was established, and looks at past and future budget authority with the budget fiscal year centered on "Year 3."
Budget authority has yet to be established for the President’s FY 2020 proposed budget. That budget did disclose that the Treasury Department is working with state regulators and industry groups and evaluating reforms to the TRIP program, with a view to potentially extend the program beyond its current December 2020 expiration date.
When counting people for the Census, is more simply better?
March 19, 2019
Yesterday’s Chicago Tribune had a front page story about the 2020 Census. It was headlined “Experts Worrying About ’20 Census,” with a subheadline “Illinois is said to need good count ‘more than almost any other state.’”
Federal funding for government programs is tied to population counts reflected in the once-a-decade Census counts. These population counts also matter for the number of seats in Congress, and drawing of legislative districts.
The Federal Bureau of the Census aims to begin its counting efforts in remote areas of Alaska, highlighting that some populations are harder to count than others.
In Illinois, a group called the Illinois Complete Count Commission has started a “get out the vote” campaign. The group is stressing how important it is for Illinois to have an accurate and complete count. They politely cite the fact that many people are “not motivated to respond” to the Census, and stress that the Census Bureau is guided by confidentiality guidelines when counting individuals.
Is it possible, however, that some people are especially motivated to motivate people not motivated to respond when federal dollars and political representation are involved?
Consider in turn whether Census has to manage the risk that some states might be more motivated to “get out the vote” than others.
California Dreaming, meet Texas Tea
March 26, 2019
When asked to name states in financial difficulty, many people would include California among the top candidates. The response “Texas” probably isn’t on the tip of the tongue for most people, a reasonable reaction given the tailwind from inmigration and above-par economic growth in Texas in recent decades.
Texas can take credit for some of its success, but the state also owes some of its good fortune to factors like a two-decade bull market in oil prices – until the last few years, anyway, when a reminder that oil prices, like housing prices, don’t always grow to the sky.
In a recent op-ed in Forbes, Chuck DeVore of the Texas Public Policy Foundation reviewed recent fiscal developments in Texas, and concluded:
“Yet as much as Texas lawmakers rightly criticize California for its big-taxing, spendthrift ways, when it comes to local government spending and property taxes, Texas has no leg to stand on. In fact, Texas local government is increasing taxes and spending at a higher pace than its rival California.”
Local government spending and property taxes are not alone.
Looking across the 50 states, Truth in Accounting ranks the states on our bottom-line measure of government fiscal condition called “Taxpayer Burden.” In our latest analysis, the state of California ranked 43rd out of the 50 states, with a Taxpayer Burden of $22,000. Somewhat surprisingly the state of Texas didn’t even make the top half of the list, ranking 32nd with a Taxpayer Burden of $10,100.
Things get more interesting when you look at city governments.
Truth in Accounting ranks the 75 largest cities in the nation on our measure of their fiscal condition. California (15) and Texas (9) account for almost one-third of all those cities. The average Taxpayer Burden for the cities in both of these state is worse than the 75 city average, and the average ranking for the nine Texas cities is actually worse than the average for the California cities.
When a Trust Fund is not to be Trusted
March 26, 2019
Earlier today, I got an email from the Social Security Administration (SSA) reminding me to review my Social Security Statement. It said the statement had important information, including “estimates of your future benefits.”
At least they didn’t tell me to review my account. They only asked me to review my statement, with estimates of my future benefits.
Why is this so curious? Uncle Sam speaks with a forked tongue.
The U.S. Government does not include debt owed on securities issued to the Social Security “Trust” Fund among the liabilities on its overall balance sheet. Nor does it include the much higher ($15 trillion+) hole in the net present value of future Social Security receipts and payments.
In past public testimony, officials have stated that program obligations do not meet the government’s definition of a liability, given that the government controls the law and can change it any time.
But in 2017, the SSA introduced a new website enabling people to sign in and see their statements. The front page of the website delivered a deceptive message to the public.
It said “Set yourself free,” in big letters, followed by “Open a my Social Security account today and rest easy knowing that you are in control of your future.”
But the government also says that those estimated benefits are not debts of the government, given that the government controls the law!
After I wrote of the troubling implications of this messaging in late 2017, the SSA took that front page down and replaced it with a kinder, gentler front page.
But this morning’s reminder from the SSA prompted me to go look at the SSA website again. The new one up there has taken some of that older, less-than-consistent messaging.
The main image on the front page has text that reads “Putting you in control … Learn what you can do online.” Near the bottom of the front page, there is a link to the “my Social Security” page, like the one with the past deceptive message. The text below that link says it helps us to “Check out your Social Security Statement, change your address, and manage your benefits online today.”
Things are moving into deeper, more treacherous waters again.
If it is “my Social Security,” and the government says you can “manage your benefits,” aren’t those obligations of the Government?
In turn, clicking on that “my Social Security” link, it takes you to a page that says you can “create your personal my Social Security account today.”
So these aren’t just “estimated benefits.” I apparently have an “account.”
An account of what? Something the Government doesn’t believe it owes me?
In the recently released President’s Budget for FY 2020, the “Analytical Perspectives” document includes language in Chapter 4 (Federal Borrowing and Debt) that clues us in on the nature of Uncle Sam’s ambiguous promises.
At the outset of the chapter, we are told that “Debt is the largest legally and contractually binding obligation of the Federal Government.”
That sounds like a firm commitment, and a liability, right? What is this “debt” stuff?
There are two main types, according to the ensuing discussion. The first paragraph of this section introduces the “debt held by the public” (which curiously includes securities held by the Federal Reserve System, but let’s put that aside for now). The next paragraph begins “In addition, at the end of 2018, the Department of the Treasury had issued $5,713 billion of debt to Government accounts.”
It sounds like that $5.7 trillion is debt, and therefore a legally and contractually binding obligation of the government, doesn’t it?
Then, the chapter starts splitting the hairs. We get an explanation, consistent with past administrations, that this latter class of legally and contractually binding obligations are effectively obligations of the government to itself:
However, issuing debt to Government accounts does not have any of the credit market effects of borrowing from the public. It is an internal transaction of the Government, made between two accounts that are both within the Government itself.
So much for my Social Security account. So much for taking control of my future.
In 2014, Jacob Soll penned a wonderful book titled “The Reckoning: Financial Accountability and the Rise and Fall of Nations.” In the introduction, Soll tells the story of Louis XIV, King of France in the mid-to-late 1600s. Louis carried his kingdom’s account books on his person, books that were prepared twice a year.
Until the red ink, and bad news, became too heavy to bear. Soll stated that “If good accounting meant facing the truth when the truth was bad, Louis, it seemed, now preferred ignorance.”
Speaking those famous words, “l’Etat c’est moi,” he apparently meant it. No longer would a functioning state interfere with his personal will.
Speaking of “my Social Security Account,” and the importance of accounting in securing accountability in a republic like ours, that French phrase translates to “The State is Me.”
How 'unsustainable' will Uncle Sam’s finances be in the annual financial report coming this afternoon?
March 28, 2019
At 3pm ET today, the Treasury Department will release the annual financial report of the United States Government for fiscal 2018.
The federal government’s financial position has deteriorated significantly in the last two decades. On our accounting, the federal government’s negative net position has quadrupled (downward) since 2000.
Significant accounting and financial issues shroud the government’s reported results, and we acknowledge uncertainty underlying our own reckoning. When faced with challenging financial valuation exercises, however, some simple cues can help inform analysis.
Here’s a chart showing the number of times the word “unsustainable” appears in the annual financial report in recent decades.
The use of this word arrives in discussions of the sustainability, or lack thereof, in the finances of the federal government of the United States of America. Under current law and policy, and looming demographic trends, the debt/GDP ratio is projected to mushroom in coming years, and so high that a growing number of observers inside and outside government question whether we really keep going on like this.
Last year, the word "unsustainable" appeared 15 times in the report. Will the number of references go up, down, or stay about the same this year?
US government finances still deteriorating
March 28, 2019
The federal government released the annual report of the U.S. Government for fiscal 2018 this afternoon. The government’s finances deteriorated significantly, and more recent reports suggest the trend is only getting worse in 2019.
Our measure of the unfunded federal debt rose from $101 trillion in 2017 to $105 trillion at fiscal year-end 2018. Extending that figure to end-of-March 2019 leads to a current estimate of $107 trillion, or about $707,000 per taxpayer (based on individual income tax filings).
The number of times the word “unsustainable” appears in this report has been on a significant long-term uptrend, from zero times in 1998 to 15 times in 2017. It rose again to 16 times in 2018. The introductory “Results in Brief” section of the report had a new subsection this year, titled “An Unsustainable Fiscal Path.” In other words, the topic of sustainability of federal government finances is not only growing as a matter of discussion, but it is now explicitly emphasized, right up front.
The federal government’s estimate of the “Fiscal Gap” – the combination of spending cuts and/or tax increases needed to keep the government debt / GDP ratio from rising in the future – doubled in 2018. This figure is expressed as a percent of GDP. The government began reporting this calculation back in 2010. A high or rising fiscal gap represents deteriorating finances.
The federal budget deficit “rose” from $666 billion in 2017 to $779 billion in 2018. The budget deficit is a cash-accounting metric based on receipts and outlays. Net operating cost – based on revenue and expenses, more of an accrual accounting measure – rose modestly to $1,159 billion -- or more than a trillion dollars.
The increase in the unfunded federal debt provides another informative measure of the annual “deficit.” Our measure of the debt increased by $4.5 trillion for 2018, about four times as high as the government’s reported net operating cost.
It's also worth noting how long it took to get the report this year. The report was delayed by the federal government shutdown early in 2019. Maybe the federal government should take its financial reporting responsibility more seriously.
Some eerie similarities in USSR and US government accounting?
May 2, 2019
I just got a cool new book (from 1989) in the mail. The Coming Soviet Crash, by Judy Shelton. Written two years before the USSR imploded, Shelton took a close look and warned that USSR government finances were in much worse shape than they appeared on the surface, given deceptive accounting practices.
Consider the first chapter title and headlines, in light of our mission here at Truth in Accounting:
1. The Internal Budget Mess
Forever Balanced
Adding up the Numbers
What is the Plug Figure?
Obscuring Reality
The book’s dust cover notes include
“Yet, as Shelton documents, Soviet financial statements contain skillful discrepancies and omissions that disguise the true condition of the internal budget. To increase its total yearly revenue figure to a level that preserves a budget surplus illusion, the Soviet government must issue credits. Those credits, disguised as revenues, are carried in the financial statement as if they represented actual contributions to the budget.”
Here’s a good question or two in the book that we might be asking today in the USA:
“… The question is: Are Soviet authorities themselves aware of the real status of the internal state budget? … the reliance on state credit to balance the budget will continue. In the meantime, we have to wonder, are the Soviet authorities keeping two sets of books?”
Looking forward to a closer read.
Who’s in control of your Social Security benefits?
May 8, 2019
The Wall Street Journal subtitled an April 22 article “Social Security Costs to Exceed Income in 2020, Trustees Say” with “The trust fund to be depleted by 2035, they add.”
What funds, if any, are in that “trust fund?” Is it really a fund?
That piggy bank doesn’t have cash, or gold bars. It holds unique, non-marketable securities issued by the U.S. Treasury. And the annual “Analytical Perspectives” section of the President’s budget regularly tells us that the securities issued to the Social Security trust fund represent obligations of one government account to another, not obligations to Social Security participants.
This is consistent with the federal government’s accounting treatment of the massive unfunded present value obligations in Social Security (and Medicare). Those obligations are not reported as debts on the federal government’s balance sheet, under the reasoning that the government controls the law (and the benefits), and can change the law at any time.
But this treatment is not consistent with the Social Security Administration’s website allowing people to view their “accounts,” and telling people that the website tool “puts you in control.”
Yesterday, the Peter G. Peterson Foundation published a related primer titled “What Are Federal Trust Funds?” The primer took care to emphasize that “Federal trust funds bear little resemblance to their private-sector counterparts, and therefore the name can be misleading. … Further, the federal government owns the accounts and can, by changing the law, unilaterally alter the purposes of the accounts and raise or lower collections and expenditures.”
Truth in Accounting believes the federal government should report the massive unfunded obligations for Social Security and Medicare as liabilities on its balance sheet. Granted, the government can change the law. Until it does so, those debts deserve to be booked. And the federal government should also correct the misleading claims to citizen “control” of their Social Security accounts at the Social Security Administration’s website.
Are Modern Monetary Theorists writing the U.S. government’s annual financial report?
May 13, 2019
In late March, the Treasury Department issued the latest annual financial report of the U.S. government. The financial statements include a balance sheet reporting $3.8 trillion in assets and $25.4 trillion in liabilities. Subtracting $25.4 trillion from $3.8 trillion leaves you with lots of trillions of dollars of negative net position.
Should “we” be concerned?
Introducing the balance sheet, the authors of this report give us the following comforting sentences:
There are, however, other significant resources available to the government that extend beyond the assets presented in these Balance Sheets. Those resources include Stewardship Land and Heritage Assets in addition to the government’s sovereign powers to tax and set monetary policy.
In other words, maybe we don’t have to worry as much, given that the government can tax us, and inflate the value of our money away.
This argument smells a bit like Modern Monetary Theory (MMT). MMT proponents discount concerns about government deficits and debt, given governments can create money. The prospects for inflation are also discounted by MMT proponents, who claim that governments can control the money supply by taxing excess money out of circulation.
MMT has gained some recent growing popularity, and has also sparked heated debate and criticism. The accounting angles to the debate are certainly interesting, and a topic for another day.
But for now, consider the claim in those sentences above that the government possesses the “sovereign powers to tax and set monetary policy.”
Our government certainly has the power to tax, and to set monetary policy. Those powers have been established in our Constitution.
But our Constitution is grounded in some more fundamental principles. It starts with three important words – “We the People.”
We have a republic in the United States of America, if we can keep it, anyway. It is a republic grounded in popular sovereignty. The government is not our king – that’s what we rebelled against.
Our government’s annual financial report should help secure the integrity of the public purse, and the accountability of our government to the people.
As a reporting entity, however, here we have the government telling us that it possesses the sovereign power – in a document it should humbly present to us for a record of its stewardship (or lack thereof).
Those sentences noted above have appeared in the federal government’s annual financial report, in various forms, every year since 2000. From 2007 to 2011, with the backdrop of the worst economic and financial crisis since the Great Depression, they even added “and the power to print additional currency” to the power to set monetary policy.
This year, however, we had an interesting development.
Those sentences stopped referring to the “Government’s sovereign powers to tax and set monetary policy.” Instead, they now call the government “the government.”
They stopped capitalizing the G in government – in those sentences, and in the rest of the document!
As Neil Armstrong once said, “That’s one small step for a man, one giant leap for mankind.”
Illinois legislature makes big financial decision – without some numbers
May 28, 2019
Yesterday, the Illinois House of Representatives voted to approve placing a proposed amendment to the Illinois Constitution on the 2020 voter ballot. This amendment would allow imposing higher income tax rates on taxpayers with higher incomes, as opposed to the flat tax rate called for under the Illinois Constitution since 1970.
Yesterday’s Memorial Day vote was strictly on party lines, and followed a similar move by the Illinois Senate in early May. One thing the debate over and passage of the measure didn’t follow, however, was any discussion of Illinois’s financial statements for fiscal 2018, a fiscal year that ended June 30 last year.
That's because Illinois still hasn’t released those statements, as of mid-2019! Illinois legislative representatives chose to move ahead anyway, even though the latest financial results from an audited financial report available to citizens and their elected representatives are for a year that ended almost 700 DAYS AGO! This year, the report is significantly later than the last two years.
Taxpayers have a date by which they have to file their tax returns. Illinois government leaders apparently don't think they need important financial statements before they release grandiose budget plans, or pass important tax legislation.
We will be monitoring the accounting and financial reporting implications of the Illinois income tax debate closely in the months ahead. Why legislative leaders chose to go ahead without a public annual report for last year – well, things don’t appear to off to a good start re: rational legislative deliberation.
Do governments ever go out of business?
June 4, 2019
A couple weeks ago, The Washington Post reported on a plan developed by downstate Illinois lawmakers to attempt to separate Chicago from the State of Illinois. Developments like “New Illinois” and related efforts to promote bankruptcy possibilities for Illinois cities raise important accounting questions.
Back in the early 1980s, governments carved out their own accounting standard setter, GASB, instead of the accounting framework for the private sector laid out by FASB. They argued that governments deserved their own rules, given how different governments were from private businesses.
For example, a “White Paper” on GASB’s website states:
“Because governments often have the power to tax—a right in perpetuity to impose charges on persons or property—they have the ability to continue operating in perpetuity. In contrast, business enterprises are at risk of going out of business because their ability to generate revenues depends upon market-determined demand for their goods and services.”
The power to tax has limits. Migration trends and initiatives like “New Illinois” underscore how market forces can discipline governments, too.
State and local governments are not alone. The frequency of the word “unsustainable” has been rising dramatically in the annual Financial Report of the US Government in the last two decades.
More fundamentally, every year, on July 4, we celebrate a relevant example how governments can go out of business.
A new way to visualize federal government fiscal conditions
June 4, 2019
Earlier this year, the Hoover Institution (at Stanford) introduced a cool new website allowing anyone to learn more about the fiscal condition of the United States government.
It’s called America Off-Balance. The front page isn’t exactly filled with good news. It is titled “America is Facing a Fiscal Crisis.”
If you go to that page, and just click on the middle of the page, nothing happens. Then, when you start scrolling down with the wheel on your mouse, the bad news starts coming.
Underneath the front page, there are significant learning materials available, and a page with a running series of articles from scholars there.
You can read a press release from the Hoover Institution about this new website here.
Recommended.
A shout out to the Lucy Burns Institute on the 100th anniversary …
June 4, 2019
… of the day Congress approved the 19th amendment to the U.S. Constitution, and sent it to the States for ratification.
The Lucy Burns Institute is a Wisconsin-based non-profit dedicated to principles we care about at Truth in Accounting. They include fundamentals like the nonpartisanship of truth, how informed voters form the foundation of democracy, and helping citizens learn about government with accessible and reliable information.
So what was the 19th Amendment? And who was this Lucy Burns person, anyway?
The 19th Amendment states simply:
The right of citizens of the United States to vote shall not be denied or abridged by the United States or by any State on account of sex. Congress shall have power to enforce this article by appropriate legislation.
The women’s suffrage movement in the early 1900s culminated in the 19th Amendment, after ratification by three-fourths of the United States in 1920.
Lucy Burns was an Irish Catholic New Yorker and leader of what became, at a 1916 meeting at the Blackstone Theater in Chicago, the National Woman’s Party. The main cause of the party was gaining the right to vote for women. Burns was a dynamic leader who spent more than a few hours in jail, where she was actually force-fed during a hunger strike.
At Truth in Accounting, we appreciate the motivation underlying the mission of the Lucy Burns Institute, and share their dedication to honoring the voting franchise.
How long will Chicago have to wait for its financial report this year?
June 11, 2019
I’m not talking about the Sox or the Cubs, or any pennant race.
In an article this morning, Fran Spielman of the Chicago Sun-Times reported on some concerns among members of the Chicago City Council over new Mayor Lori Lightfoot’s plan to cut the budgets of several council committees.
Notably, at the end of the article, Spielman reported on the confirmation of Susie Park as city Budget Director, and on what Park told reporters after the Council meeting.
Since her election, Lightfoot has spoken of inheriting a massive budget shortfall. Park was asked by reporters about the size of the hole after the meeting. She said she was waiting for the results of the annual city audit before answering the question.
This sounds like a responsible response, if not a whiff of fresh air. In the past, city leaders have talked about budgets as if they are reality. Budgets are prospective, planning documents, and the audited results arrive after the budget year, when we get some clues whether the government really ‘walked the talk’ on its stated intentions.
Consider that the Illinois state legislature recently passed massive budget legislation without an audited financial report being available, at least to the public. Illinois has been without audited financial results for more than 700 days.
Those audited results aren't perfect, given cash-like accounting for funds statements. But how long will we have to wait for Chicago’s annual audited financial report this year?
The City of Chicago states that it is required by state law to produce its annual report within 6 months of the end of the fiscal year. In recent years, the June 30 deadline has come and gone, and the report takes a few weeks to finally appear ...
… and with a letter of transmittal to the citizens dated June 30, the date it was required to be produced.
Will the new administration follow in past footsteps? Or will the early breath of fresh air remain breathing?
Do Jake and Elwood need to shine their shoes?
State economic outlooks joined at the hip with government financial conditions
June 13, 2019
The American Legislative Exchange Council (ALEC) recently released its annual “Rich States, Poor States” report. This report analyzes the 50 United States on a variety of dimensions deemed to reflect relative economic competitiveness, and produces an Economic Outlook ranking for the states.
The criteria they use are dominated by tax variables, and states with lower and/or flat taxes score higher in the rankings. The criteria also include measures of state government debt burden, the size of government in the economy, the implications of state liability and labor laws for business-friendliness.
Truth in Accounting includes the annual results from ALEC’s ranking every year from 2008 to 2019 in our State Data Lab database. We’ve noted for years that state rankings on ALEC’s scorecard tend to line up with our rankings of state financial conditions, as measured in our Taxpayer Burden calculation.
The chart below shows the rankings of 10 states on Truth in Accounting’s Taxpayer Burden measure of state financial conditions. The 10 states include the five states that rank highest on ALEC’s economic rankings (Utah, Idaho, North Dakota, Nevada, and Indiana), and the five states that rank lowest (New York, Vermont, Illinois, California, and New Jersey).
You can see a clear distinction between these two groups of states as they rank on financial conditions. States with brighter economic outlooks as identified by ALEC also tend to be states with state governments that have managed their finances responsibly, and not shifted the costs of past government spending to future taxpayers.
States with poor economic outlooks have done the opposite.
Empty seats – another sign of looming fiscal crisis?
June 28, 2019
A couple days ago, the Senate Budget Committee held a hearing titled “Fixing a Broken Budget and Spending Process: Securing the Nation’s Fiscal Future.” The hearing featured testimony from U.S. Comptroller General Gene Dodaro, and his recommendations to develop alternatives to current debt limit procedures as a source of fiscal discipline.
Committee chair Sen. Mike Enzi (Wyoming) opened the hearing, with Dodaro in the witness chair. You can see what the hearing looked like in the picture below.
In turn, please consider watching these 6 minutes of hearing video. It includes good questions from Sen. Mike Braun (Indiana). Sen. Braun expressed dismay with the low hearing attendance, and cited it as a symptom of deeper fiscal governance failures. He asked Dodaro what the future could look like if the government continued to wait until a fiscal crisis forced it to act.
Chicago’s annual financial report is late – again
July 1, 2019
State law requires the City of Chicago to publish audited financial statements within six months of the end of the fiscal year. June 30th has now come and gone, however, and Chicago hasn’t delivered the FY 2018 statements to its citizens.
This has been four years in a row, now, that this has happened. In the last two years, it took more than a week after June 30 to see those statements, at least publicly – even though they included dates on the “letter of transmittal” that were before June 30.
The report has taken on greater significance this year, with a new Mayor in office. In addition, it is worth noting recent developments such as the indictment of the alderman who served as former chair of the Chicago City Council Finance Committee, whose jurisdiction included financial reporting.
President Trump does something right
July 2, 2019
He is reportedly set to nominate Judy Shelton for the Federal Reserve Board of Governors.
Shelton has called for a return to a gold standard. This may, or may not, be a good thing to do. But at least it gets a voice at the Fed.
More importantly, Shelton called the downfall of the USSR, soon before it happened, citing fake government accounting.
Sounds like a valuable nomination in the USSA.
How big is the federal government, compared to Walmart?
July 15, 2019
A few days ago, CNSNews asked Senator Mike Braun of Indiana “Does the federal government spend too much money?” Sen. Braun’s answer included “Well, you know what my answer is going to be, yes. … It’s a terrible example for the rest of the country, for state governments, for any other part. …”
“But when it comes to the biggest business in the world, the federal government which is about eight times the size of Walmart, who else can run a 20% loss each year? … If you do the math, that’s about what it is and it’s going to get worse in the future -- and then throw it on a credit card? I think it’s an embarrassment.”
Eight times as big as Walmart? That’s pretty big.
In its latest annual financial report, Walmart reported about $500 billion in revenue. The federal government of the U.S. reported nearly $3.5 trillion in revenue, about seven times the size of Walmart.
But how big is Walmart in reported assets? Total debt? Compared to the U.S. federal government?
The federal government reported total assets about 19 times Walmart’s assets of $200 billion in the latest fiscal year.
The size of the federal government’s debt compared to Walmart's is where things get interesting, and underscores Sen. Braun’s concern about “throwing it on a credit card.”
Taking the federal government’s reported debt at face value, the federal government’s debt runs not eight, nor 80, but about 200 times as high as Walmart's debt
And if you include unfunded obligations for social insurance programs such as Social Security and Medicare, as we do at Truth in Accounting, the federal government’s debt runs not eight, nor 80, nor 200 times as high as Walmart, but about 880 times as high.
How long can this go on?
Well, it already has gone on a long time, and there are important differences between Walmart and the federal government explaining why. Walmart has to depend on consumers freely choosing whether or not to shop at its stores (and its websites). And Walmart can’t print its own money.
The federal government has the power to tax, and to print money, and unashamedly cites those powers as resources that aren’t listed as assets on its balance sheet.
But the federal government regularly claims these powers are in its possession as sovereign powers -- in a document theoretically securing the accountability of the government to the real sovereign in the United States of America – We the People.
Bitcoin: A national security issue?
July 19, 2019
Cryptocurrencies have been getting more policymaker attention and wordplay in recent weeks. A few days ago, U.S. Treasury Secretary Steven Mnuchin labeled cryptocurrencies a “national security issue,” citing their potential use in illicit drugs, tax evasion, extortion, human trafficking and terrorist financing.
It’s good to show concern about such things, but whenever the powers that be start framing financial matters in terms of national security, it is time to check your wallet. That’s because of a dramatic, interesting area of constitutional law called “national emergency powers.” During a time of war and/or declared national emergency, more authority can flow into the executive branch allowing for extraordinary actions.
Consider March 1933, when President Franklin Delano Roosevelt declared a “bank holiday” amidst a nationwide banking panic. FDR issued an executive order effectively closing all the banks in the U.S. He also ordered all Americans to turn in their gold. For legal authority, FDR and his advisers cited the 1917 Trading With The Enemy Act – a wartime source of extraordinary presidential authority. This helps explain FDR’s “as if it were a foreign foe” framing in 1933.
After most Americans turned in their gold, the U.S. government promptly repriced the dollar in terms of gold, penalizing anyone who obeyed the orders.
Language dating back to the Trading With The Enemy Act remains on the books today. Consider 12 U.S.C. 95a, which includes:
During the time of war, the President may, through any agency that he may designate, and under such rules and regulations as he may prescribe, by means of instructions, licenses, or otherwise— (A) investigate, regulate, or prohibit, any transactions in foreign exchange, transfers of credit or payments between, by, through, or to any banking institution, and the importing, exporting, hoarding, melting, or earmarking of gold or silver coin or bullion, currency or securities, and …
How do like them apples?
One item to look at when Illinois’ (late) financial report finally appears
July 23, 2019
For citizens and taxpayers hoping to learn about the quality of Illinois state government finances, 2019 has been a long, long wait. Illinois still hasn’t issued audited financial statements for fiscal 2018, which ended June 30 last year. In other words, the latest year for which we have audited financial statements ended more than two years ago.
Speaking of a long wait, and state government, I’ve been on hold now for more than five minutes. I’m not calling to try to get that report again. I’m actually calling the Illinois Department of Employment Security. I’m trying to find out how much money has been paid in unemployment insurance taxes on my behalf in my lifetime, and how much money, if any, I ever get back for this “insurance.” A topic for another day.
In the forthcoming (hopefully) Illinois annual financial report, Illinois will finally report an OPEB liability on its balance sheet for the first time. “OPEB” stands for “Other Post-Employment Benefits,” principally retiree health care benefit payments but also including things such as life insurance benefits. For decades, just like pensions, state and local governments distributed OPEB promises without funding the benefits, leading to massive liabilities that the Governmental Accounting Standards Board (GASB) allowed governments to accumulate off the balance sheet.
Until the latest fiscal year, when Illinois will finally be reporting that debt on its balance sheet. We’ve been recasting state and local government balance sheets for years at Truth in Accounting to include our estimate for both pension and OPEB debts, which are now arriving on reported balance sheets with the thud of billions and billions of dollars.
Here’s a chart comparing OPEB debts for Illinois, Indiana and Michigan since 2009, based on underlying actuarial and other reports. This chart is created using Truth in Accounting’s State Data Lab, which allows you to create and share charts with others. You can see Illinois’ OPEB running above $50 billion in 2017.
In turn, coincidentally or otherwise, here’s a look at the share of outbound moves for Illinois, Indiana and Michigan reported in United Van Lines’ annual migration study. Illinois, one of the most indebted state governments in the nation, has fewer and fewer stones to try to draw blood from.
Words, numbers, and U.S. government fiscal stability
July 30, 2019
Accounting is about numbers, but it is also about words. The amounts on the financial statements are in numbers, and they quantify amounts for the accounts labeled with words. And the reporting process isn’t just about the financial statements – it includes lengthy verbal discussions of results, risks, and responsibilities.
Financial reports can get pretty complex, but there are times when simple cues provide value. Simple word counts can unearth significant clues.
Consider AIG -- American International Group, one of the largest insurance enterprises on Planet Earth, until it imploded in the 2008-2009 financial crisis. In 2007, AIG sported a balance sheet boasting more than one trillion dollars of assets. It had some of the most complicated financial statements on the planet. Analyzing those statements wasn’t easy. However, a simple indicator was flashing a bright warning signal.
Credit default swaps (CDS) provide a form of insurance on financial instruments. AIG issued a lot of CDS on mortgage-backed securities in the 2000s, effectively standing behind those instruments while absorbing massive risks in the event of a housing market downturn. Which arrived, in spades, combining with other factors to sink the AIG ship – at least before government used taxpayer resources to stand behind the devastation AIG posed to its creditors.
Not everyone was surprised. For example, the book (and movie) “The Big Short” chronicles the work of some bright, independent thinkers that anticipated the housing market devastation and broader financial and economic crisis.
Here’s a clue that was available in 2007 – a simple one. Anyone who counted the number of times that the term “credit default swap” appeared in AIG’s annual report from 2003 to 2007 would have seen a jaw-dropping jump in 2007 -- in a report that came out in early 2008, before AIG’s meltdown.
Perhaps similar clues can be found in the reports of our government(s)?
That’s why we’ve added a new section to our State Data Lab database – “Rhetorical Analysis.” This section includes word counts for the number of times that informative words (and phrases) appear in the annual financial report of the U.S. government. We plan to add similar sections for states and cities.
For example, consider this chart, which shows the number of times the word “unsustainable” appears in the federal government’s annual report every year since 1998. It’s been on a long upward march, amidst discussion of the risks that federal fiscal policy is simply unsustainable given sharply higher debts and interest expense that are projected under current law and policy.
You can have some fun with other words. For example, here’s a chart that compares the number of times the words “inflation” and “unemployment” appear. The federal government itself cites how the ability of government to set monetary policy serves as a potential resource for paying off its debts, and inflation will be an important factor to watch in the years ahead.
Here’s another fun chart. It shows the number of times the words “tax,” “borrow” and “spend” appear.
Have fun, and be careful out there!
Who is Illinois’ Deputy Governor Dan Hynes working for?
August 12, 2019
The Chicago Tribune recently reported that a task force appointed by Illinois Governor J.B. Pritzker will soon announce recommendations for “improving the health of pension funds statewide.” The pensions at issue are smaller municipal plans, not the huge state-wide plans, mainly for police and firefighters employed in smaller cities and towns.
Those smaller plans are also massively underfunded, however. Proposals under consideration include consolidating the many plans in hopes of securing cost savings – as well as higher property taxes for local plans choosing to opt-in to the consolidated funds.
Pritzker named Illinois’ Deputy Governor Dan Hynes to lead the task force. The Chicago Tribune story quoted his goal for the task force -- a “solution that everybody agrees is in the best interest of the retirees and our active police and firefighters, as well as municipalities.”
That’s a lot to ask for, unless your job is to sell policy proposals with win-win assertions.
In that statement, Hynes identified three different groups with different interests. He also left out some other groups of interest.
The three groups he named include “retirees,” “active police and firefighters,” and “municipalities.” If groups are named in order of priority, it seems he puts retirees first in line. He also included “active police and firefighters,” but some things that are good for retirees may mean different things for active workers, given that the first group may benefit from “solutions” that impose higher risks for active workers waiting for future benefits.
Consider, in turn, the "retirees" Hynes is referring to. Most retirees didn't work in public sector unionized jobs, and their interests may be threatened by policies Hynes promotes as "in the best interest of the retirees."
How about the “municipalities?” To whom is he referring to there?
If higher taxes are part of the answer from the task force, the recommendations could indeed benefit retirees, active police and firefighters, and municipalities, all at once – if you define the “municipality” as the government independent of the citizens and taxpayers in the municipality.
Are higher taxes in the interest of taxpayers? Will “everyone agree” they are?
Who is Dan Hynes working for, anyway? Concentrated special interest groups like pensioners and government officials – and in turn, the bondholders who supported the systems that are now threatening the rest of us?
Or should the Governor and Lt. Governor be working for all of us -- the common good?
A missing stakeholder in the heart of new corporate governance policy
August 20, 2019
Yesterday, the Business Roundtable issued a new “Statement on the Purpose of a Corporation.” The statement was signed by most (but not all) of the nearly 200 CEOs and other leaders on the Roundtable. It proposed a historic shift away from securing shareholder primacy in the goals of a corporation.
Consider the source, including the current Chairman of the Business Roundtable, Jamie Dimon, CEO and Chairman of JP MorganChase. Introducing the statement, Dimon said “These modernized principles reflect the business community’s unwavering commitment to continue to push for an economy that serves all Americans.”
So, who are “all Americans?” The statement expresses a commitment to serve “all of our stakeholders,” and says that “each of these stakeholders are essential.” It then identifies five groups of stakeholders – customers, employees, suppliers, communities, and shareholders.
Where are the taxpayers’ yachts?
Some critics of the stakeholder view of corporate governance cite how this perspective can be abused by selfish special-interest groups, especially in a corporation with vague and open-ended goals.
Shareholder primacy isn’t necessarily perfect either. Business leaders with a fiduciary responsibility only to shareholders may feel a duty to lobby government for special favors and/or bailouts, at taxpayer expense.
But by effectively excluding taxpayers from “all Americans,” the Business Roundtable fortified the foundation for corporate statism. Corporations could still be asserted to have a duty to manipulate government for the interests not only for shareholders, but the identified stakeholders as well.
Granted, “communities” appears among the five stakeholder groups. But it was plural, not singular. Here’s how the paragraph describing that group reads:
Supporting the communities in which we work. We respect the people in our communities and protect the environment by embracing sustainable practices across our businesses.
What if supporting a community where you work includes pursuing policies that threaten people in other communities? For example, federal solutions/bailouts that promote the welfare of well-organized interest groups in some communities, at general expense? Like bailouts for big banks, or Government Motors? Or, for that matter, the City of Chicago and its pension plans?
I especially appreciated the observation below by Charles Elson, the head of the Weinberg Center for Corporate Governance at the University of Delaware, quoted in today’s Chicago Tribune.
“It limits accountability for these people to anyone. You can always make an argument that no matter what you’ve done, some stake (holder) will benefit.”
It just seems ironic, or worse, that a statement advertised to serve “all Americans” then proceeds to carve out special categories of interest. And the words "tax" and "taxpayer" are not to be found in the Statement.
For that matter, consider how many customers of these multinational corporations are not "Americans."
Taxpayers of the world, unite! You have nothing to lose …
Some "highlights" from the "latest" annual financial report for the State of Illinois
September 3, 2019
Late last week, the State of Illinois finally released its Comprehensive Annual Financial Report (CAFR) for Fiscal 2018. Here are some highlights (and lowlights) from the report.
· The report was released August 29, 2019 – 425 days after the end of the June 30, 2018 fiscal year. In other words, we just learned about a year that ended more than a year ago.
· The letter of transmittal – addressed to the “Citizens of the State of Illinois,” “Honorable J.B. Pritzker, Governor” and “Honorable Members of the General Assembly” -- was dated August 22, 2019, even though the Citizens of the State of Illinois didn’t have a chance to see the report until August 29.
· The report was released August 29 – right before the three-day Labor Day weekend. For anyone concerned that government agencies tend to release bad news right before long weekends, to minimize the news impact, the Illinois CAFR release appears to be in that ballpark.
· Truth in Accounting’s “Taxpayer Burden” bottom-line measure of Illinois’ fiscal condition continued to deteriorate, based on the audited results in the report, falling from a negative $50,800 per taxpayer to $52,600 per taxpayer.
· Illinois’ “net revenue” (revenue less expenses, on an accrual basis) “improved” from 2017, but only in the sense that things were getting worse at a slower pace. Illinois’ expenses exceeded revenue by nearly $5 billion in 2018. This measure has been negative in 11 of the last 15 years, despite the “balanced budget” provision in Illinois’ state constitution.
· The continuing net revenue shortfall and deterioration in net position in 2018 arrived despite a nearly 20 percent increase in general tax revenue (sales taxes, income taxes, and other taxes). Since 2005, Illinois general tax revenue has risen much faster than personal income in the state.
· Illinois reported interest expense hit $2 billion (rounded) in 2018 for the first time. Illinois’ reported interest expense has nearly doubled since 2005, despite falling market interest rates. In 2018, Illinois’ reported interest expense amounted to more than $450 per taxpayer -- for interest expense, the cost of borrowing, alone -- before a dime was spent on government services. In Indiana, by way of contrast, the same reported interest expense was less than $20 per taxpayer in 2018.
· Since 2005, the number of times the words “debt” “borrow,” and “tax” appeared in the Illinois CAFR rose two times, three times, and three times, respectively, faster than the number of pages.
· The Illinois CAFR included the acronym “OPEB” 21 times in 2017, and 143 times in 2018, as Illinois and other state and local governments were finally required to recognize related retiree health care and other retirement benefit obligations as a liability on the balance sheet. (OPEB stands for “other post-employment benefits.”) Another $55 billion in previously unreported liability arrived on Illinois’ balance sheet last year. Our calculation of the state’s OPEB liability, based on the state’s own assumptions, has risen 50 percent since 2009.
· The word “million” appeared 239 times in 2018, in line with the 240 times it was there in 2017. The instances of the word “billion” rose from 119 in 2017 to 128 in 2018. Since 2005, the number of “millions” fell 25 percent, while the number of “billions” rose 60 percent. The word “trillion” has yet to appear in Illinois’ annual report.
· The words “prompt,” “penalty,” and “late payment” haven't appeared in Illinois’ annual report in the last five years, either. This raises questions about the quality of accounting and disclosure of the costs of late payment penalties under Illinois’ “Prompt Payment Act.”
Snow jobbing Social Security
September 5, 2019
With winter looming over many of us, consider snow jobs and Social Security.
The Merriam-Webster dictionary defines “snow job” as “an intensive effort at persuasion or deception.” Lexico defines it as “A deception or concealment of one's real motive in an attempt to flatter or persuade.” The Urban Dictionary calls it “An effort to deceive, overwhelm, or persuade with insincere talk, especially flattery.”
Another version comes from The Cambridge Dictionary, which refers to a “snow job” as “an attempt to persuade someone to do something, or to persuade someone that something is good or true, when it is not.”
I’ve been putting together a public finance glossary, and various references to Social Security were what sparked this mission seeking out what people mean by the term “snow job.” That last definition from The Cambridge Dictionary seems to ring loud and true, when thinking about how the government frames Social Security spending.
The federal government puts spending in two categories. One category is called “Mandatory Spending,” and the other is called “Discretionary Spending.” Where do you think Social Security lies?
Social Security, also called an “entitlement” program, is included in “Mandatory Spending.” That sounds like something the government has to do, right? As opposed to discretionary spending, which seems to be subject to government discretion?
Trouble is, the government also chooses to exclude the massive unfunded obligation ($15 trillion+) for Social Security from the debts it reports on its balance sheet. The rationale for this discretionary choice? The government has stated that those are obligations under current law and policy, which the government can change at any time.
Does that sound like mandatory or discretionary spending to you?
The end of the world / US fiscal year is coming!
September 17, 2019
We are less than two weeks away from the end of September, which means we are also two weeks away from the end of the federal government’s fiscal year (which ends September 30, every year).
That is the date upon which the federal government’s financial statements (which cover a full year up to and including September 30) are based.
Does that mean that is when we get a financial report from our government?
No. Like private, publicly-traded companies, it takes some time for the government to report its financial results.
But our government takes longer, and over the last decade, increasingly longer, to deliver the news.
The chart below comes from Truth in Accounting’s government financial database. It shows how many days it takes after the fiscal year-end to get our federal government’s annual financial report.
It’s been taking longer and longer. Last year, a government shutdown impacting “nonessential” government programs was partly to blame for a nearly-six-month wait.
When does reporting financial results, in a report theoretically securing the accountability of our public servants to the citizenry, become nonessential?
In turn, note that in most years (covering Democratic as well as Republican administrations), that annual report has been delivered after, not before, the annual State of the Union address.
Is that part of the plan? Does that help explain why those State of the Union addresses spend so little time talking about the financial condition of the federal government?
Should we start a futures market, based on how long it takes the government to get it to us this year? A simple contract could be based on a yes/no outcome, whether it comes out before the State of the Union address.
Recession indicator provides a reminder about government financial reporting
October 1, 2019
The world of economics includes a huge jungle of statistics. Some of them are fearsome, dangerous beasts – complex, difficult to calculate, untimely, and subject to discretion if not willful distortion. Others are gentle, caring, helpful creatures – simple, timely, reliable and worth caring for (and about).
The former scary category arguably includes things like Gross Domestic Product, the Consumer Price Index, and measures of the Money Supply.
From the world of kinder and helpful statistics, the economics world gave us some scary news today.
The Institute for Supply Management (ISM) provides a monthly Report on Business, which includes a simple, timely and reliable index of manufacturing activity. Unfortunately, the news wasn’t good. That gentle creature has been weeping lately, with negative (below 50) index levels combining with things like a narrowing/inverted yield curve to raise warning bells about a developing recession.
The ISM index used to be called the NAPM (National Association of Purchasing Managers) index. The organization would poll its members, and ask simple questions such as “Is your firm’s production up, down, or about the same this month?” and “Are the prices you pay for supplies going up, down, or staying about the same?” From there, they would add the percentage of people saying “up” to the number saying “about the same,” and develop a simple index number.
This index isn’t perfect, but it is available in a very timely fashion, compared to other economic statistics. The latest ISM Report on Business was released today, October 1, for the month of September that just ended. The simple index design yields another value -- it isn’t revised in the future as statisticians update their previous estimates. And it doesn’t need to be audited, like corporation or government financial accounting information.
For anyone trying to stay on top of economic trends on a regular basis, the ISM index has long been one of the best things to watch.
So, let’s assume (which may not be the case) that a recession is getting underway. How is it impacting our local, state, and federal government finances? Are they ready for a recession? How can we stay on top of how they are doing?
Back in late August, a little more than a month ago, the State of Illinois released its Comprehensive Annual Financial Report. But that report, released in August 2019, covered a fiscal year that ended more than a year earlier (in June 2018). And we won’t see the next federal government annual financial report until about February 2020 – a report that covers a fiscal year that ended yesterday (as an assumed recession was just getting underway).
Meanwhile, today, the stock market -- a key contributor to investment income (and risk) in public pension plans -- dropped more than 300 points (on the DJIA, speaking of indexes), on the heels of the recession news from the ISM index. Another reason to be concerned as citizens and taxpayers, especially we hold much of the downside of the investement risk in these pension plans.
We are often flying while blind when it comes to understanding the current condition of the public purse. We would all benefit from more timely – and reliable -- government financial reporting.
How did your stock portfolio do today, Illinois taxpayers?
October 2, 2019
The Dow Jones Industrial Average fell almost 500 points today, after dropping more than 300 points yesterday.
Some Illinoisans may think they aren’t in the stock market because they don’t own stocks or mutual funds. They may have another think coming.
That’s because Illinois state and local governments provide retirees with defined pension benefits guaranteed under current law.
How does that put non-stock-owning taxpayers in the stock market?
Those plans are woefully underfunded, but they still have significant investment portfolios. For example, the Teachers Retirement System of Illinois reported a liability of $127 billion in its latest annual financial report, backed by $52 billion in invested assets. Stocks form a big chunk of those invested assets.
That chunk can get bigger, and it can get smaller – like it did yesterday and today.
Why should taxpayers care? They are effectively in the market. Under current law, taxpayers have to make up for any shortfall in the investment portfolio below the defined pension benefits protected by law.
Have a nice day.
Can the young and the unborn count on Social Security?
October 21, 2019
The U.S. Government reports the financial condition of Social Security in its annual financial report. Social Security is included in the “Statement of Social Insurance,” which is reported after the main overall financial statements like the Statement of Net Cost, Statement of Operations and Changes in Net Position, and the Balance Sheet.
The Statement of Social Insurance includes Social Security and Medicare. For both of these programs, the Statement includes calculations of the present values of future program receipts and expenditures, based on projections of future cash flows under current law and policy, and projected demographic trends.
The three groups include current participants who have reached eligibility age (retired people and beneficiaries receiving benefit payments), current participants that have not reached eligibility age (people working that are having payroll taxes deducted from their paychecks), and future participants (the young and the unborn).
For each of these classes of participants, the government calculates the discounted present value of future money projected to flow into the system, and the present value of future expenditures. From there, it subtracts the present value of expenditures from the present value of receipts, and arrives at a net present value for the overall program.
For Social Security, that net bottom line came to a negative $16.1 trillion in 2018, “up” from a negative $13.3 trillion in 2014. In other words, the financial position of Social Security deteriorated by almost $3 trillion over those four years.
You can see those amounts reported on the Statement of Social Insurance on p. 61 in the 2018 Financial Report of the U.S. Government. Social Security is in the top table in that Statement.
Take a closer look at the three different classes of participants, in that top Social Security table, and how they add up to a negative $16.1 trillion. Netting the present value of expected receipts and expenditures for the three classes separately, you end up with an even more disturbing picture.
The massive $16.1 trillion overall hole for Social Security arrives despite a huge POSITIVE ($18.8 trillion) contribution to the program assumed to come from future participants!
What does this imply about the value of Social Security for the young and the unborn, if they are expected to provide a huge positive boost to current participants? Does this not imply a massive intergenerational welfare transfer, from future to current participants?
Note that the U.S. government chooses not to include the massive unfunded overall future obligations in Social Security in its balance sheet, under the reasoning the government can change the law at any time. At Truth in Accounting, we believe it should be included and reported as a debt under current law and policy, on the balance sheet, and then changed if and when the government changes the law (and the expected taxes and benefits).
In turn, we calculate the net positions of Social Security (and Medicare) using a “closed group” perspective, when calculating our assessment of the “true” federal debt. We do not rely on the cash flows assumed for future participants, for a few reasons. One of them relates to how the term ”future participants” can be thought of as an oxymoron – how can you be a participant in something you never had a choice (or a vote) to participate in?
Here’s what we calculate for the net unfunded promises of the Social Security system, under this “closed group” calculation (that doesn’t count on future participants):
In turn, here’s what has happened to the net position for the program from future participants in Social Security themselves, over the past decade:
That massive and growing positive contribution from future participants does not imply good things for future participants themselves.
Hazardous-duty pay for Senator Elizabeth Warren?
October 22, 2019
United States Senator Elizabeth Warren (Massachusetts) walked the picket lines in Chicago, Illinois, today, in support of the Chicago Teachers Union striking for higher pay and benefits, and smaller class sizes.
The hazardous part was actually weather-related. High wind warnings in Chicago today, 50 degrees, and occasional slashing rain showers.
Taxpayers and citizens should take note of the timing of Warren’s appearance for another reason. Senator Warren’s support for unionized Chicago teachers comes amidst her new plans to develop hundreds of billions of new federal spending for K-12 public education, historically a province of state and local government.
Whether taxpayers everywhere should come up with money benefitting irresponsible jurisdictions like Chicago raises important equity and sustainability questions.
Chicago and other financially desperate school systems lack a “solution” available to the federal government, in the short run. State and local governments can’t print their own money, and the federal government can.
Massive new federal spending on state and local public education can be viewed as a bailout of sorts. In fact, supporters of new federal money for state and local governments sometimes point to the federal government’s response to the 2008-2009 financial crisis as justification for their plans.
“If the government could just bail out the big banks, poof, like that, why shouldn’t we get equal treatment?”
This incentive highlights an issue about accounting for the costs of the 2008-2009 financial crisis. Money for things like the federal student loan program and new federal spending for state and local government programs like public education doesn’t just come out of nowhere – even for entities that can print their own money.
Pensions, bailouts, and moral hazards threatening taxpayers
October 24, 2019
The words “hazard” and “moral” are two of the most important words in finance, especially when you put them together. “Moral hazard” is a term rooted in insurance industry risk management and pricing practices, and describes how people may take more risk once they get insurance.
The term applies in spades to public sector as well as private sector arrangements. As citizens and taxpayers, we all participate in government schemes providing explicit and implicit forms of insurance to well-organized special interest groups, including banks. In 2008 and 2009, we got our lunch handed to us as our risky financial system imploded, with subsequent bailouts providing a signal that the public purse is available to failing enterprises.
Yesterday, Wyoming Senator Mike Enzi delivered a Senate floor speech with a clear, simple warning of looming moral hazards facing taxpayers from pension systems. Legislation that has ALREADY PASSED THE U.S. HOUSE OF REPRESENTATIVES titled the “Rehabilitation for Multiemployer Plans Act of 2019” would extend subsidized credit and other forms of assistance to massively underfunded “private” sector pension plans, at public expense.
A cost estimate for the bill from the Congressional Budget Office estimated it could increase deficits by almost $50 billion over the next decade, but another estimate prepared at Enzi’s request asserted that the true cost could run more than $100 billion.
Enzi’s concerns may actually help illustrate how the “true” cost estimate understates the cost to taxpayers. Enzi cited how private sector pension plans generally may relax their funding and take more risk. But he didn’t expressly address the possibility, were the legislation to be enacted, that troubled (and massive) state and local government pension plans would then try to draw from the federal well in the future.
Sadly, private and public sector pension deterioration has another initiator, one illustrating the need to fully account for the cost of bailouts. The massive government assistance handed out in 2008-2009 financial crisis socialized losses in ways fomenting greater moral hazard in our financial system more generally, including pension systems.
In his speech, titled “Pension Bailout Will Leave Taxpayers Holding the Fiscal Bag,” Senator Enzi noted that “You can bet if this bill goes through, those plans will be expecting their bailout, when the time comes, What a precedent! All of this is setting up for additional bailouts in the future, potentially putting taxpayers on the hook for hundreds of billions of dollars.”
Senator Enzi concluded “This bill would put the vast majority of workers, who don’t have their own pension plans, on the hook for bailing out the small percentage who do. That hardly seems fair.”
How much do state and local taxpayers pay lawyers and insurance brokers?
October 28, 2019
Last Friday, Robert Herguth and Tim Novak of the Chicago Sun-Times connected some dots about several of the Southwest Chicago suburbs whose government offices were recently “visited” by agents leading a federal investigation into Illinois corruption. The suburbs purchased insurance through an entity that employed the son of the Speaker of the House of Representatives of Illinois Michael Madigan.
There is an interesting accounting issue relating to this story.
When aggregating expenses on the state and local government version of an income statement (the “Statement of Activities”), you don’t see line items for things like insurance expenses, or legal fees.
What you do see are expenses aggregated into warm, fuzzy, public-service mission categories like “Public Safety,” “Education,” and “Health and Human Services.” Government accounting standards subsume insurance and legal expenses under those categories.
It would be nice to be able to compare jurisdictions on how much they pay for lawyers, and for insurance, and how those expenses trend over time. For example, to try to assess if they are overpaying for politically-connected services, or simply to get a handle on how many taxpayer dollars are getting gobbled up in those areas.
Buffalo, New York ‘releases’ its 2019 financial report
November 13, 2019
On Monday, November 11, The Buffalo News published an article covering the "release" of the City of Buffalo’s Comprehensive Annual Financial Report for the fiscal year ended June 30, 2019.
The article was headlined "Buffalo closes last year in the black, expects casino funds to start rolling in." It emphasized two positive-sounding developments – closing out the year with a "surplus," and an increase of $900,000 in "reserves" from the previous year.
Claims like these are worthy of scrutiny, given the fungibility of government funds accounting and the use and abuse of similar references in other places, including Chicago. To scrutinize them, however, you need the actual Comprehensive Annual Financial Report referred to in that Buffalo News article.
By the end of the day yesterday, November 12, the actual report had yet to appear at the City of Buffalo’s website. I called the city comptroller’s office and asked if the report was available. I was told it had been distributed in print form, and the city had yet to put it on its website. I asked for a pdf version of the document, and was told it would be on the agenda "first thing in the morning" the next day (today, November 13).
At the end of the day today, I have yet to receive the report, nor have I received a response to an email and a voice message I left earlier in the day.
This isn’t just an isolated story. It has wider implications.
Consider how publicly-traded firms "release" their annual (and quarterly) annual financial reports. These reports are required to be filed with the SEC, and they are released (and posted to the Internet) when they are released.
No such mechanism exists for state and local governments in the United States.
Why not?
Tomorrow, the DoD delivers audited financial statements
November 14, 2019
Tomorrow, the Department of Defense (DoD) will deliver its Agency Financial Report for fiscal year 2019. The report will include the results of the second “full” DoD department-wide audit. Last year, almost 30 years after the Chief Financial Officers Act first directed federal departments to deliver audited annual financial statements, the DoD finally certified it was ready to be audited.
The massive effort last year cost hundreds of millions of dollars, yielding (again) a “disclaimer of opinion” on the department-wide financial statements. However, the audit also identified specific sources of weakness in accounting systems and financial controls. Tomorrow’s report should include valuable insight into how well the DoD is addressing those weaknesses.
Truth in Accounting will prepare a report card on the audit results, like we did last year, as a way to gauge how much improvement is being made, and to gain insight into how cost-effective the audit process will be.
You can review our assessment last year here. For the current year, the DoD Office of Inspector General expects to produce a valuable review of the audit results in mid-to-late December, and we may have to wait for that report to prepare our own assessment.
A waterfall of red ink underneath Buffalo’s ‘surplus’
November 14, 2019
On Monday, November 11, The Buffalo News reported on the results in the City of Buffalo’s annual financial report for fiscal 2019. The article was published well before Buffalo’s comprehensive annual financial report (CAFR) was publicly available. The article was headlined “Buffalo closes last year in the black, expects casino funds to start rolling in.” The first sentence was:
“The City of Buffalo closed out its 2018-19 fiscal year with a $948,715 surplus, as expected, thanks to a $7.5 million advance from the state on $17 million in disputed casino funds owed by the Seneca Nation of Indians.”
A review of the actual CAFR tells a different story. Buffalo had a better year in 2019 than in 2018, to be fair, as the city’s general revenue exceeded net expenses.
But a surplus?
Buffalo’s reported surplus arrived in the city’s general fund, where measured revenues exceeded expenditures for the 2019 year. But the city’s overall financial condition is remarkably poor – despite (or because of) the fact that its pension funds are relatively well-funded.
The acronym OPEB stands for Other Post-Employment Benefits. New accounting standards have finally required state and local governments to include these obligations as liabilities on the balance sheet. OPEB includes retiree health care benefit promises, as well as things like life insurance. In Buffalo, the OPEB dollar amounts are jaw-dropping.
The table below lists ten cities ranking from 81 to 90 in the U.S. in terms of population, including Buffalo, and reports the total OPEB liability for those cities (and their component units) in the latest annual financial report. The table is ordered from lowest to highest OPEB dollar amount. Dollar amounts are in millions.
Gilbert
Arizona
$2
Glendale
Arizona
$6
Winston Salem
N. Carolina
$16
North Las Vegas
Nevada
$36
Chandler
Arizona
$54
Madison
Wisconsin
$66
Lubbock
Texas
$141
Laredo
Texas
$166
Reno
Nevada
$224
Buffalo
New York
$3,524
OPEB is only one liability. As noted, Buffalo’s pension fund is in relatively good shape. But that massive $3.5 billion OPEB hole explains why Buffalo’s overall financial condition is so poor. The table below shows the unrestricted net position for the same ten cities, ranking them from best (Gilbert, Arizona) to worst (Buffalo, NY). Dollars are in millions.
Gilbert
Arizona
$435
Winston Salem
N. Carolina
$246
Chandler
Arizona
$181
Madison
Wisconsin
$19
Lubbock
Texas
-$35
North Las Vegas
Nevada
-$43
Glendale
Arizona
-$168
Laredo
Texas
-$225
Reno
Nevada
-$312
Buffalo
New York
-$4,021
Here’s a chart showing the unrestricted net position for these ten cities. Unrestricted net position arrives after liabilities are deducted from assets, and is akin to shareholder equity in the private sector (and the “Money Available (Needed) To Pay Bills” that we calculate for governments at Truth in Accounting). Buffalo is that waterfall at the far right. Dollars are in millions.
So much for that “surplus.”
Signs of progress, and new sources of concern, in DoD’s Annual Financial Report
November 19, 2019
Late Friday afternoon of last week, the Defense Department (DoD) issued its Agency Financial Report. The report arrived on November 15, as expected and as of the same date last year. The DoD received a disclaimer of opinion on its financial statements, as it did last year, and the main service branches (Army, Navy, Air Force, and Marines) continued to get disclaimer opinions. Among the 20+ component entities, the same entities earning unmodified (clean) opinions earned them again this year, while there were no new entities earning clean opinions.
The more things stay the same, on the surface, the more they change. There is a lot going on under the surface. They include signs of progress, as well as new sources of uncertainty, if not future inquiry and/or investigations.
We now have a DoD agency-wide financial report with audited financial statements to compare with an audited report from a year ago -- for the first time ever since the 1990 Chief Financial Officers Act required executive branch departments to issue audited financial statements. Unfortunately, it is too soon to be comparing results from year to year, for a few reasons. For example,
· In the “Emphasis of Matter” section of the auditor opinion letter to the Secretary of Defense and the DoD Comptroller, the DoD Office of Inspector General (DoD-IG) newly emphasized that it received what it called a “preliminary final” Agency Financial Report, a characterization it did not make last year. This is one sign among others that we don’t yet have apples to compare to apples, as opposed to apples and oranges.
· The Management Discussion & Analysis section of the report noted that the FY 2019 audits resulted in the issuance of more than 1,300 “Notices of Findings and Recommendations” (NFRs) as of November 15. These can’t be compared to year-ago results, yet, however, because this section also stated that the DoD “anticipates receiving significantly more NFRs as the auditors finish compiling their findings and developing the related NFRs.”
For the 2018 audit results, Truth in Accounting based our own “Audit Report Card” on a summary report that wasn’t delivered by the DoD Office of Inspector General until January 2019, a couple of months after the DoD Agency Financial Report. It appears we may have to wait for that report again, to develop our rankings and provide an overview of progress and/or deterioration in DoD auditability.
That doesn’t mean there aren’t notable and newsworthy results in what has been delivered to U.S. citizens and taxpayers so far this year.
· The number of material weaknesses cited and summarized by the DoD Inspector General declined significantly from last year (20) to this year (14).
· DoD apparently made significant progress as 10 identified and named material weaknesses last year were not separately identified in the DoD-IG letter this year. But that letter also identified four newly-named material weaknesses, including a curious “Suspense Accounts” item as well as the “Joint Strike Fighter Program.” (The F-35 fighter jet).
· The DoD IG letter newly identified a difference of opinion with the DoD on the reporting for “Security Assistance Account” balances administered by the DoD. The DoD-IG believes these balances should be on DoD’s books, and audited as such, while DoD believes they belong elsewhere in the U.S. Government-wide financial statements.
At the date of the DoD Agency Financial Report, the Federal Accounting Standards Advisory Board had yet to make a decision on this last question, and those balances were not audited or considered by the DoD-IG in developing its audit opinion. The “Security Assistance Account” balances result from foreign arms sales and foreign military training and financing programs worthy of interest, inquiry, and good accounting.
So the DoD may have made progress, for example, in closing about 20 percent of the “Notices of Findings and Recommendations” delivered in last year’s first “full-scope” department audit. But we have much more to learn in the months, and years, ahead.
Truth in Accounting will continue to monitor developments, and we will deliver our own DoD Audit Report Card in the coming weeks.
Correction (November 26): The number of material weaknesses identified and discussed in the auditor opinion letter actually increased from 20 in 2018 to 25 in 2019. That section of the auditor opinion letter left significant space at the bottom of the page after the 14th identified weakness, leading me to believe that was the end of the section.
Sorry, my bad. My own material weakness!
In total, the DoD resolved 1 of the 20 material weaknesses identified last year. Three of the material weaknesses identified last year were consolidated with other material weaknesses, and the DoD IG identified and discussed nine new material weaknesses.
Should home appraisals include analysis of civic finances?
December 2, 2019
Liz Farmer recently wrote an article for Rate.com titled “Little-noticed home buying risk: Your city’s financial problems.” It was picked up by the Chicago Tribune, among other places. She argued that “While the traditional home buying process is full of due diligence title searches to make sure you’ll actually own what you’re paying for, appraisals to make sure you’re not overpaying it lacks any warnings about civic finances. Take Chicago…”
From there, Farmer cited Truth in Accounting’s calculation of the combined Taxpayer Burden facing taxpayers in the City of Chicago, which ranks the worst among the 10 most populated cities in the country on this measure.
Looking across the 48 continental United States, what do you think has happened to home prices, when comparing the five best-ranking states (“Sunshine States”) on Truth in Accounting’s Taxpayer Burden to the five worst-ranking states (“Sinkhole States”)?
Here’s a look at the average FHFA Home Price Index for those two groups since 2003, indexed to the housing market peak in 2007:
The “Sunshine States” (North Dakota, Wyoming, Utah, Idaho and Tennessee) have had a robust recovery, while the “Sinkhole States” (Delaware, Massachusetts, Connecticut, Illinois, and New Jersey) are barely back to 2007 levels.
At least through 2018. We will see if the recovery in the Sinkhole States continues.
Do governments ever go out of business? How about Illinois governments?
December 3, 2019
The “going concern assumption” is a key consideration for financial reporting. If an entity is deemed a going concern, many assets may be valued at their cost, as opposed to current (or liquidation) values. If the entity is found to be at risk of liquidation, however, that risk should be disclosed, and the entity may have to recast its financial statements on a liquidation basis.
The going concern assumption matters for businesses, as well as governments.
The Governmental Accounting Standards Board (GASB) last updated its guidance on going concern considerations for state and local governments in March 2009, in GASB Statement No. 56. The timing of the statement is certainly interesting, amidst the worst economic and financial crisis in the United States since the Great Depression. That statement affirmed that financial statement preparers have a duty to evaluate whether the government has the ability to remain a going concern for 12 months after the date of the financial statements, even if the financials were prepared a few months after the date for the financial statements.
Among the criteria that could undermine an assumption that the entity was a going concern, GASB Statement No. 56 included “legal proceedings, legislation, or similar matters that might jeopardize intergovernmental revenues and the fiscal sustainability of key governmental programs.” In turn, were entities to deem themselves at risk of liquidation, the statement directed the financial statements to include footnote disclosures about the factors responsible, along with discussion in the “Management Discussion and Analysis” section of the annual financial report.
In 2015, the GASB embarked on a new research project on going concern disclosures, which may or may not lead to new formal guidance and/or standards for state and local government financial reporting. This new project followed on the heels of a GASB grant funding statistical research into indicators of government financial stress. Announcing the project, GASB raised the question “Are the current going concern indicators presented in note disclosure guidance appropriate for state and local governments, in light of the fact that, even under severe financial stress, few governments cease to operate even when encountering such indicators?”
When the end is near, however, it can be hard for organizations to admit it. Their leaders may try to inspire confidence in themselves, forestalling a collapse in customer and supplier confidence until it is too late. Consider American International Group (AIG), the huge insurance company that went belly-up in the 2008-2009 financial crisis. AIG was reporting tens of billions of dollars in shareholder equity for several quarters after the market had already deemed the common shares worthless.
AIG proved to actually be a going concern, of some form, anyway, given the government bailouts in the financial crisis.
But what about governments? Unlike businesses, they have the power to tax, don’t they? Do governments ever go out of business?
Every July 4th, we celebrate a rare but relevant example.
How about Illinois state and local governments? Are they going concerns?
Well, in plain English, yes, the State of Illinois and the City of Chicago are going concerns. They are still going, and their financial condition are sources of concern.
But how long will they keep going?
It depends – including, for one thing, on a new initiative called New Illinois. New Illinois states:
Our vision is of a State free from a tyrannical form of government, where residents will be able to experience a government representing their constitutional rights, as guaranteed in Article IV, Section 4 of the U.S. Constitution. … Illinois is a failed state and is not fulfilling its responsibilities to its citizens. We believe the situation is beyond reformation and will only be remedied through an Article IV, Section 3 state split provided for in the U.S. Constitution.
New Illinois seeks to educate citizens about their constitutional right to create a new state, splitting “Old Illinois” in two pieces, one of which would not include the City of Chicago.
This probably isn’t something that would happen in the next 12 months, but it is worth watching.
4
Will new accounting improve financial market stability in the years ahead?
December 10, 2019
A decade has passed since the massive 2008-2009 financial crisis. Next year, an important new accounting standard is slated to go into effect. It is supposed to address prior weaknesses that were asserted to lie in the intersection of bank capital regulation and accounting principles.
This relates to how banks and other financial firms like insurance companies recognize losses in their financial assets. The world is moving from a prior “expected loss” framework, where entities didn’t recognize losses until they were deemed “probable,” to a new “current expected credit loss” (CECL) framework.
The expected loss framework has been blamed for keeping entities from using forward-looking economic forecasts, expected credit deterioration among borrowers, or consideration of industry cycles in determining whether a “probable” loss had already occurred. The accounting and financial regulatory powers-that-be criticized the old model for allowing entities to not fully reserve for losses expected to develop in the future.
In hindsight, of course, the 2008-2009 disaster certainly happened – however well large financial institutions and their government overseers/enablers saw it coming or not.
The new CECL accounting analysis now requires entities to estimate and recognize future credit losses at the moment of recognizing the asset, and on an ongoing basis for future reporting periods. The considerations for making these valuation calls will include superficially more-sophisticated forward-looking appraisals, including “reasonable and supportable forecasts” for the lifetime of the financial instruments.
Have we taken a step in the right direction? Have we reduced taxpayer exposure to government bailouts of the financial sector in the future?
A few months ago, University of Chicago Booth School accounting professor Haresh Sapra penned an insightful (and readable) review of the new lay of the land. Titled “Why the big banks aren’t safe yet,” Sapra outlined uncertainties in bank capital regulation, given how accountants and bank regulators aren’t always singing the same tune.
For example, bank regulators may stipulate that banks hold a certain amount of capital compared to assets. But how “certain” that capital is depends on the uncertain accounting value of assets; if banks are not recognizing loan losses promptly that could make capital regulation more lenient than believed (or advertised) by bank regulators.
I’m reminded of a joke that was making rounds on trading desks back in the financial crisis. “Nothing on the left is right, so nothing on the right is left.”
In his August 2019 article, Sapra chose to try to be optimistic about the new CECL framework, noting that it could allow lenders to more proactively recognize losses in their asset valuations. But he was careful to caution about the “silos” in which accounting and financial regulation operate.
This has created silos in which accounting is often left out in the cold on discussions of the overall stability of the financial system. My research demonstrates that banking regulators should take accounting seriously, and accounting standards setters should take banking regulation seriously.
I agree, and would add another note of caution. The new, more sophisticated-looking asset valuation framework can also provide more room for discretion in not recognizing losses. And I’m reminded of the “new,” more sophisticated and “risk-sensitive” bank capital regulatory framework arising out of the Basel Accord beginning back in 1988. That framework turned out to be gamed as a means for effectively reducing capital buffers in the banking system. It arguably raised, not lowered, the risks leading up to the 2008-2009 crisis.
Bank regulators and the accounting community should heed Sapra’s call for taking each other seriously. Hopefully, they won’t do so in a way that exposes us to disaster again. And we can’t just rely on their claims to good intentions.
We the People need to Watch our Wallets.
Pensions, OPEB… is ‘deferred maintenance’ the next shoe to drop?
December 13, 2019
A member of Truth in Accounting’s Board of Directors has been urging us to take a closer look at government financial reporting for infrastructure and related maintenance requirements. This is an area of growing interest and concern.
Governments have undertaken to provide a wide variety of resources like roads, water and wastewater management facilities, and physical plants (like schools) that need ongoing maintenance as well as occasional large refurbishment and/or replacement projects.
Historically, however, many governments have accounted for these activities on a “pay-as-you-go” basis, expensing large maintenance projects as they are undertaken. A growing number of interested parties suspect that this accounting has combined with other incentives to lead government officials to delay needed maintenance and repair.
Some people believe the dollar amounts of delayed but necessary spending are so large they warrant recognition as a new liability on the balance sheet, along the lines of “deferred maintenance obligations.”
Many governments looked the other way while pension and other retirement benefit obligations bloomed off the balance sheet. Unfortunately, “deferred maintenance” may be a candidate for the next flower to blossom.
It’s worth taking a cautionary note. Construction and related industries provide critical services for governments. Unfortunately, in more than a few places (like Illinois), they have also been fodder for worthy concern about the cost and value provided to citizens and taxpayers in an area that can be abused by corruption. It is also possible that some people are exaggerating the problem.
The Governmental Accounting Standards Board (GASB) does not have any current research project dedicated to this issue. However, they do have a broader “Capital Assets” project that includes these considerations. It was added to GASB’s research agenda in August 2019. It listed 11 main research areas, including how governments capitalize assets, depreciate them, estimate their service lives, and assess changes in their condition over time.
The last of the 11 listed areas in GASB’s “Capital Assets” project dealt specifically with deferred maintenance. It called for research into how governments collect, estimate and report deferred maintenance needs, and whether those estimates should be in external financial reports.
Truth in Accounting will be taking a closer look at government reporting in this area – including at the federal government level as well as state and local governments.
The public sector is bigger than ‘the government’
December 18, 2019
How many people in the United States work for the government?
A quick way to answer this question is to look at government statistics. The Bureau of Labor Statistics (BLS) in the U.S. Department of Labor produces employment statistics by industry. Some of those industries include local, state and federal governments.
In the latest release for “The Employment Situation,” the BLS estimated that there were 14.6 million people employed by local governments, 5.2 million people employed by state governments, and 2.8 million people employed by the federal government, out of a total 152.3 million people employed in the United States.
That’s based on formal employment relationships, however. In a world where government contracts with other organizations to provide goods and services, and where public capital effectively stands behind “private sector” financial organizations supported by a government safety net, drawing clear lines between the government and the private sector isn’t so easy.
The public sector is effectively much larger than “the government.” Consider that the Federal Reserve Banks report total assets of $4.1 trillon, more than the total assets reported by the entire federal government. How can this be? Well, the Federal Reserve Banks' financial statements are not consolidiated in the US government's financial statements. And employment in the Reserve Banks is not included in federal government employment, either.
In turn, for the BLS establishment survey, government employment covers only civilian employees; military personnel are excluded. Employees of the Central Intelligence Agency, the National Security Agency, the National Imagery and Mapping Agency, and the Defense Intelligence Agency also are excluded.
For another example, there’s a reason we call them “public utilities.” Water and electric utility rates aren’t taxes, formally, but they take on similar characteristics in a world where government influence reigns.
In coming weeks, I will be drawing some lessons from the career of former U.S. Senator Paul Douglas (1892-1976) for perspective for following the Illinois corruption investigation next year. Douglas had an amazing career, with notable contributions in the areas of public utility regulation and ethics in government.
How many people in the United States work for the government? There’s another reason the answer is bigger than just government employees. The Tax Foundation computes something called “Tax Freedom Day,” which depends on how many months it takes to work to pay government taxes.
And if you include the per-taxpayer amount of unfunded federal government obligations, there is a sense in which we are all working for the government.
Some updates to watch in 2020
December 19, 2019
Here’s a brief review of some of the interesting state-level data that we will be updating and reporting about as the new year progresses. Future blog posts will also highlight city and federal government data updates.
United Van Lines Outbound Shipments Percentage: United Van Lines is one of the largest interstate moving companies in the US. Each year since 1978, it has published a study of the share of outbound moves in total moves for all 48 contiguous states. In recent years, we’ve seen higher outbound moves in states with relatively high Taxpayer Burdens, as calculated by Truth in Accounting. This study normally comes out in early January. Here’s a look at Indiana compared to Illinois since 2002 on this measure.
Fertility Rates: The data is developed in a program called the “National Vital Statistics Reports,” conducted within the Centers for Disease Control and Prevention. One challenge facing social insurance programs at the federal level, and state and local governments as well, has been declining fertility (birth) rates. In recent years, we’ve seen that fertility rates are running lower in fiscally challenged states.
Lawyers per 10,000 Residents: Each year, the American Bar Association compiles statistics on the number of attorneys “active” and “resident” in the 50 states. As a general rule, state governments in states with more attorneys per capita tend to be in worse financial condition. And states with more attorneys also tend to have higher costs of living.
Regional Price Parities: This state-by-state measure of buying power is produced each year in May, by the Bureau of Economic Analysis (BEA) in the U.S. Department of the Census. States with governments in poor financial condition also tend to be states with relatively high costs of living.
Building Permits/Home Prices: We include these housing-related measures in State Data Lab. States with governments in relatively poor financial condition have had less of a recovery in housing markets since 2009 than other states, consistent with migration and economic growth trends. The building permits data come from a statistical program in the Department of the Census, and the home price data we include comes from a data program at the Federal Housing Finance Authority.
Taxpayer Burden: This is Truth in Accounting’s bottom-line measure of overall government financial condition. We release it for all 50 states in September in our annual flagship report, “The Financial State of the States.”
Net Revenue - Change in Net Position: Forty-nine of the 50 states have some form of balanced budget requirement, either in state constitutions or state laws. If states balance their budget every year, how have so many states run up massive debts? One answer lies in cash-based budget accounting practices, including for example a practice of counting anticipated borrowing proceeds as revenue. The “Change in Net Position” provides a check on the validity of these claims, because it is derived from more reliable accrual-based accounting principles. As a general rule, states that “walk the talk” on truly balanced budgets are in much better financial shape, and score better on measures like Gallup’s polling results for trust in state government.
Net Revenue - Change in TIA Money Needed to Pay Bills: State and local government financial reporting practices have improved in recent years, as they now include large debts for pension and other retirement benefits long left off the balance sheet. But state balance sheets have been clouded with the introduction of suspect “deferred outflows” line items. The change in Truth in Accounting’s “Money Needed to Pay Bills” measure provides another check on where state (and local) governments are walking the talk on balanced budget requirements. We don’t include the “deferred outflows of resources” line item GASB has stipulated be added to the assets, to arrive at the “Net Position.”
Transparency Score: Once we have all the results compiled for the 50 states in our “State of the States” report, we compile a broader measure of government reporting that we call our “Transparency Score.” States that score higher on our Transparency Score also tend to have retained higher trust from their citizens, as reflected in Gallup poll results. They also tend to be in better financial condition. The practices that are assessed in our Transparency Score provide examples of good things to do, and good things to avoid doing.
Presidential Election Popular Vote Percentage: At the end of the year next year, we also have an election. The election-based data in State Data Lab includes party share of vote totals and voter turnout rates. States that tend to vote Democratic tend to be in worse financial shape, and another trend we have noticed is a relatively rapid increase, from low levels, in the share of Libertarian party votes. We’ve also noticed that states with relatively high voter turnout also tend to be in better financial condition, holding other factors constant.
Note: As 2019 comes to a close, we have decided to rebrand our “State Data Lab” website. The decision reflects the growing, broader range of information we compile and deliver, including city as well as federal government information.
The new name for the website will be Data-Z.
The ‘Illinois Exodus’ – You can pay me now, or pay me later
January 6, 2020
Late last year, two government reports added to the growing body of evidence that mismanagement of government finances have led to significant outmigration from the Land of Lincoln.
The annual population estimates from the U.S. Census Bureau showed Illinois’ population declined for the sixth consecutive year in 2019. And a report from the Internal Revenue Service (with more thorough data on people and money but only updated through 2018) showed large-scale net out-migration of people and taxable income.
As more than a few observers have noted, it ain’t just the weather. Here’s a look at population in Illinois and its neighboring (cold) states since 2010. (The chart is indexed to 2010 = 1.0 to make the states the same size, helping the comparison)
Looking across the 50 states, the tendency is the warmer the state (especially in winter), the better the population growth. But that tendency is not nearly as strong as other variables of interest, including measures of government finances.
For example, WalletHub computes and reports an annual ranking of the 50 states based on their measure of state “tax burden.” WalletHub adds property, sales, and income tax revenue for the states, relating them to overall state personal income. On that basis, Illinois has ranked in the bottom 10 states for tax burden (based on how high) in the last three years. And looking across the 50 states, the 10 states with the lowest population growth in the last decade had much lower-than-average rankings on WalletHub’s tax burden measure compared to an average ranking for the 10 states with the best population growth.
Here’s a look at comparing state population growth rankings to their rankings on WalletHub’s “tax burden” measure. The states at the upper right (including the red dot, Illinois) have both low population growth and high (worse) WalletHub tax burdens.
“You can pay me now,” or” you can pay me later” were the punch lines in a 1970s commercial for Fram Oil Filters. So it goes, after a fashion, with government spending and taxes. Despite advertised balanced budget requirements in 49 of the 50 states, many states have run up huge debts anyway. They did so by running up the credit cards in ways that, until recently, never showed up as debt on the balance sheet. Accrual expenses ran far ahead of revenue – and they didn’t tax their citizens enough, given what they were spending (including expenses arising with distributing unfunded pension promises).
The result is that it isn’t just current taxpayers facing high tax “burdens.” Taxpayers in states like Illinois aren’t just threatened by current tax bills. The overall measure of state fiscal health reflected in Truth in Accounting’s (TIA) “Taxpayer Burden” accounts for the impact of debt on future taxpayer resources – for the taxpayers that choose to stick around, anyway.
Here’s a look at states using TIA’s “Taxpayer Burden” rankings, comparing them to population result. The same tendency holds – the higher the “Taxpayer Burden,” the lower the population growth. Again, Illinois is that little red dot in the picture below, ranking 2nd to last both on population growth and TIA’s Taxpayer Burden.
Compare the results for both WalletHub’s “Tax Burden” and TIA’s “Taxpayer Burden” to the chart below, which compares population growth to the “Average Winter Temperature” variable we include in our State Data Lab (soon to be “Data-Z”) website. The relationship for cold winters and population growth isn’t nearly as strong as it is for the government financial condition rankings.
Growing awareness of the “Illinois Exodus” isn’t restricted to right-wing think tanks or selected newspapers. Real estate professionals are also paying attention. And for good reason.
The chart below shows rankings of the states based on population growth in the last decade, comparing them to rankings on home price appreciation (using reports from the Federal Housing Finance Agency) since 2010. Once again, Illinois is that little red dot up there at the upper right.
The better the population growth, the stronger the home price appreciation. And as current and future taxpayers make their migration decisions, home prices (and property tax revenues) react – that’s how it appears.
A recent article at “Accounting Coach” was titled “Is Income Tax an Expense or a Liability?” For taxpayers in Illinois and similarly-situated states like Connecticut, New Jersey and New York, the best answer could simply be “Yes.”
Unless they move.
New record for Illinois outmigration in United Van Lines migration study
January 9, 2020
United Van Lines (UVL) is one of the largest home moving companies in the U.S. Every year since 1978, they have released a study of the share of outbound shipments in total shipments for all 48 continental United States. The latest results came out a week ago, and they are dismal for Illinois and other fiscally-challenged states.
The first chart below, drawn with Truth in Accounting’s Data-Z charting tool, shows the outbound migration percentage for Illinois. The state has never posted a year below 50 percent (net inmigration), and the net outmigration has accelerated significantly in the last decade.
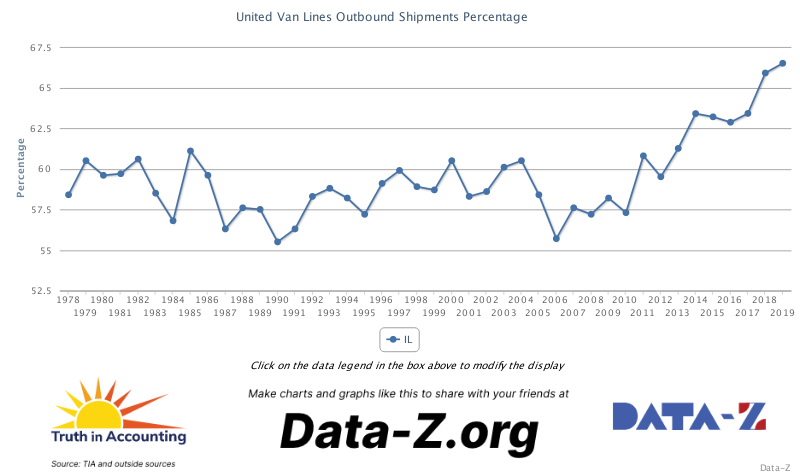
In 2019, Illinois came in second-to-last on outbound migration, trailing only New Jersey.
Here’s a look at the rankings for Illinois and its neighboring states last year. Illinois is that that little red bar to the left, ranking 2nd (only losing out to New Jersey) in outmigration.
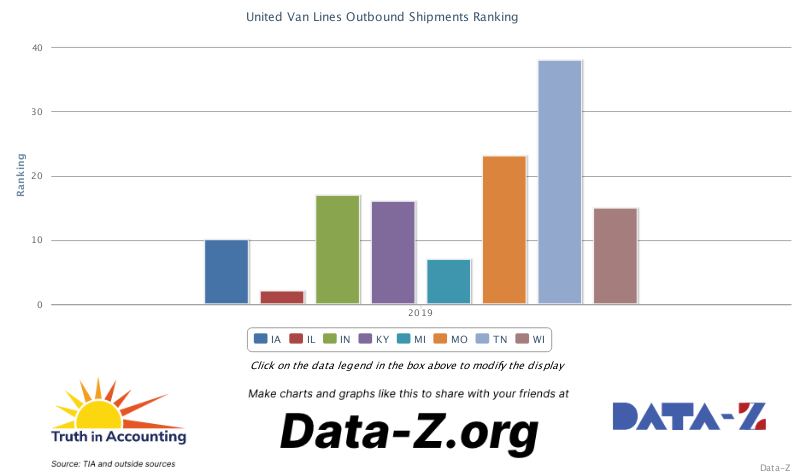
Last year, the five states with the best rankings (least net outmigration) on the UVL study were Idaho, Oregon, Arizona, South Carolina, and Washington. The five lowest-ranking states were New Jersey, Illinois, New York, Connecticut, and Kansas. The five lowest-ranking states had an average TIA Taxpayer Burden of almost $40,000 in the latest reporting year, compared to just $4,000 for the five highest-ranking states.
Migration trends have significant relationships with economic growth and property values. One could argue that any measure of taxpayer burden should also consider the income and wealth effects in fiscally mismanaged states.
The chart below updates the chart introducing this article at the top upper-right. It compares the average outbound shipment percentage for the 10 states with the highest (worst) TIA Taxpayer Burdens to the 10 states with the lowest (best) Taxpayer Burden rankings. The migration gap between these two groups continued to widen in 2019, as it has over the past decade.
Congress could broaden and strengthen oversight of accounting standards
January 15, 2020
Today, the U.S. House Committee on Financial Services held an oversight hearing titled “Overseeing the Standard Setters: An Examination of the Financial Accounting Standards Board and the Public Company Accounting Oversight Board.”
We urge the Committee to conduct a follow-up hearing. This would cover the Governmental Accounting Standards Board (GASB) and the Federal Accounting Standards Advisory Board (FASAB).
There aren’t many people in the United States aware that there is not only one set of accounting standards in the US. There are at least four main sources:
The Financial Accounting Foundation (FAF) is a private, nonprofit organization overseeing the Financial Accounting Standards Board (FASB) as well as GASB, both of which are under the FAF umbrella.
FASB standards are for private sector organizations.
GASB issues different standards for state and local governments.
FASAB issues different standards for the federal government.
And the fourth main accounting standard setter is the answer to the trivia question “Who sets the accounting standards for the Federal Reserve Banks?” (The answer is – the Federal Reserve Board of Governors).
GASB and FASAB, as well as the Federal Reserve, also deserve scrutiny, not just FASB. Showing you oversee FASB may help the Congress show it cares about investors, but oversight of GASB and FASAB could indicate they care about taxpayers and citizens, as well.
The House Financial Services Committee is currently chaired by Rep. Maxine Waters (D-California). The Vice-Chair is Rep. Michael San Nicolas of Guam, another financially challenged jurisdiction. The ranking member is Rep. Patrick McHenry (North Carolina).
There are more than 50 members on the Committee. And speaking of financially challenged jurisdictions, we note that, on a weighted average basis, the states from which the members of the House Financial Services Committee come have a weighted average Taxpayer Burden of $14,000, as calculated by Truth in Accounting, much higher than the average for states that are not on the Committee.
Given that federal actions may turn financial issues in troubled states into national matters of interest – and of interest to relatively responsible jurisdictions -- perhaps representatives in other places might consider working harder to get on relevant House (and Senate) Committees.
The nation’s mayors and their priorities
January 22, 2020
The annual winter meeting of the National Conference of Mayors started today, and will last through the week. The meeting’s stated goals include developing national urban policy proposals with a “united voice.”
Attendees vote on proposals for policy resolutions developed at the meeting. The positions that pass are distributed to the President and Congress, and are stated to “collectively represent the views of the nation’s mayors.”
Underlying this year’s meeting is the “Mayors’ 2020 Vision for America: A Call to Action.” It outlines 12 “Strategic Priorities.” Below is a simple list of the priorities. They are organized in three categories – “Infrastructure,” “Innovation,” and “Inclusion.”
Arguably, 11 if not all 12 of these priorities cost a lot of money. There is one priority called “Rewrite the Tax Code to Help Hardworking Americans and Reduce Economic Inequality.” Otherwise, none of the priorities suggest a move toward making government smaller, or cutting expenses, or addressing sometimes-massive shortfalls in funding for state and local government employee retirement benefits.
Maybe that makes sense, however, if your audience is the President and the Congress, and your city needs federal resources.
It will be interesting to watch media coverage of this conference tomorrow.
The 12 “Strategic Priorities”
Infrastructure
· Re-Imagine and Modernize the Nation’s Transportation Infrastructure
· Address Climate Change by Accelerating Clean Energy Use
· Invest in America’s Water and Wastewater Systems
· Promote American Exports, Fair Trade, and International Tourism
Innovation
· Strengthen Education, Improve Schools, and Build the Workforce of the Future
· Embrace Efficient, Effective Modern Technology While Protecting Consumers and Cities
· Rewrite the Tax Code to Help Hardworking Taxpayers and Reduce Economic Inequality
Inclusion
· Make Housing More Affordable and End Homelessness
· Guarantee Access to Affordable Quality Healthcare and Critical Human Services
· Join With Mayors and Police Chiefs to Support Public Safety for All
· Fix our Broken Immigration System
· Protect and Advance Human & Civil Rights
US households moving to freer, lower-tax places
January 30, 2020
U.S. Supreme Court justice Louis Brandeis coined the phrase “laboratories of democracy” when describing states. In more than a few states, some of the lab rats appear to have had enough.
The Internal Revenue Service (IRS) “Statistics of Income” division produces an annual report with valuable information for understanding interstate migration trends. The latest report was issued in early 2020, covering the latest available tax year (2018).
The IRS migration data program collects individual income tax filings and allocates them into “same state,” “outflow” and “inflow” return categories, which are then organized by age group and income level. “Same state” returns are the returns where a household filed in the same state as the previous year. “Outflow” returns are returns for households that moved out of that state from the previous year, and “inflow” returns are for households that moved into the state.
Net migration statistics can be calculated for every state, for example, by subtracting the number of outflow returns from inflow returns, and calculating net migration by dividing the difference by the total number of returns. This works to common-size the states.
· The 15 states with the highest net inmigration in 2018, on this measure, were (in order) Nevada, Idaho, Arizona, South Carolina, Colorado, Delaware, North Carolina, Oregon, Washington, Florida, Tennessee, Maine, Georgia, Montana, and New Hampshire.
· The 15 states with the highest net outmigration in 2018, on this measure, were (in order) New York, Illinois, Connecticut, North Dakota, Louisiana, New Jersey, Massachusetts, Kansas, West Virginia, California, Mississippi, Wyoming, Maryland, Nebraska, and Rhode Island.
Four of the 15 states with high net outmigration in 2018 were states impacted significantly by energy market developments, following on the heels of a significant drop in oil prices. So, for the purposes of comparing these two groups of states, Wyoming, Louisiana, North Dakota and West Virginia are considered special cases and excluded from the “high outmigration” states.
What characterizes the high inmigration states? How do they differ from the high outmigration states?
In a review of a variety of economic, demographic and financial factors for these 26 states, five factors stand out for how different inmigration states are from outmigration states.
1. WalletHub’s Tax Burden
2. Cato Institute Freedom Ranking
3. Balanced Budget Frequency
4. Lawyers per 10,000 Residents
5. Truth in Accounting’s Taxpayer Burden
One other factor also stands out, but the inmigration states don’t differ much from the outmigration states on this score. That is the Winter Average Temperature for the states, as calculated by the National Oceanic and Atmosphere Administration (NOAA). You can’t blame bad winters alone for outmigration, it looks like, at least for 2018.
Let’s look at the tendencies for those five significant factors identified in the table above.
WalletHub Tax Burden. WalletHub ranks the states on their estimate of total annual taxes paid for sales, property, and income taxes, expressing the result as a share of total state personal income. High IRS outflow states tend to rank lower (have higher tax burdens) than high IRS inflow states.
Cato Institute Freedom Ranking. Cato Institute ranks the states on “freedom” using an index based on a variety of metrics relating to fiscal policy, regulatory policy, economic factors, legal environment, education policy, health insurance and other factors. Higher inflow states rank higher on Cato’s freedom ranking than the high outmigration state.
Balanced Budget Frequency. 49 of the 50 states have some form of balanced budget requirement, but they vary significantly in how legally compelling there are. There are words and there are deeds, and the proof is in the pudding not in the budgets, but in the audited results released after the end of the year. As a general rule, states that report accrual expenses below accrual revenue tend to be in much better shape, financially. And the high inflow states tend to have significantly higher frequencies of truly “balancing the budget.”
Lawyers per 10,000 Residents. This ranking is done using data reported by the American Bar Association (ABA). The ABA reports the number of lawyers “active and resident” in the state, and reports that number per 10,000 residents. Higher inflow states on IRS migration tend to have fewer lawyers per capita.
TIA Taxpayer Burden. Truth in Accounting calculates a different measure of Taxpayer Burden, which is the per-taxpayer share of unfunded state government debt. Higher outflow states tend to rank lower (and have higher) Taxpayer Burdens.
Bottom line, in 2018, states attracting greater inmigration tend to be freer, lower-tax jurisdictions with governments that do a better job of responsibly managing their finances.
News - Bill's Blog
2
Federal government financial report delivered to deafening silence
March 6, 2020
Last Thursday, the U.S. Government released the annual financial report of the U.S. Government.
Bottom line, the federal government’s financial position continued to deteriorate.
And nobody cared.
Over the next two days, mainstream news media provided basically zero coverage.
One major national newspaper had prominent stories about the coronavirus, an IPO for DoorDash, parallel parking, the NFL’s likely #1 draft pick, the sale of an elevator business, research about the inflation rate, swarms of locusts in Africa and the Middle East, cellphone data handling, the resignation of the CEO of Harley Davidson, and leap year babies.
And nothing – zero – on the financial report of the United States government.
Meanwhile, 10 year Treasury yields are falling to nearly one-half of one percent.
Down is up.
News - Bill's Blog
Some lonely leaders address federal government finances
March 12, 2020
Today the U.S. Government Accountability Office released an annual report titled “The Nation’s Fiscal Health.” The report was subtitled “Action is Needed to Address the Federal Government’s Fiscal Future.” The report drew from the February release of the Financial Report of the U.S. Government, and documented continued deterioration in the government’s financial position in the latest fiscal year. The GAO offered a clear, simple warning that “the federal government is on an unsustainable fiscal path.”
The United States Senate Committee on the Budget reviewed that report in a hearing this morning. Here’s a picture of the hearing.
Gene Dodaro, Comptroller General of the United States, is at the witness table. Mike Enzi, Senator from Wyoming, is in the center of the horseshoe of Senator seats. There are two other Senators attending the presentation – Mike Braun (Indiana) and Charles Grassley (Iowa).
Otherwise, lots of empty seats.
Granted, pandemics can deflate attendance at organized gatherings. Unfortunately, this is consistent with past behavior at Senate Budget Committee meetings.
The Financial Report of the U.S. Government was issued a couple weeks ago, to deafening silence. And most of our Congressional representatives appear to be missing in action, when it comes to defending the public purse.
Sniffing for clues in word counts in Uncle Sam’s financial report
March 19, 2020
Can an "unsustainable" federal government backstop America for the coronavirus?
Simple, creative tools help provide perspective when faced with complex challenges in financial analysis.
For example, heading into the 2007-2008 financial market disaster, American International Group (AIG) offered investors, and anyone else interested, some of the most complex financial statements on the planet – for “private-sector” enterprises, anyway.
As 2007 and 2008 progressed, AIG headed into a corporate disaster – with collateral consequences.
Warning signs weren’t so readily available in the reported income statement and balance sheet. In fact, the latter was still showing tens of billions of dollars in positive shareholder equity into mid-2008, even as the market had wiped those shareholders out.
But a simple, compelling clue was available, along with other judgments made by people concerned about the conditions leading to the financial crisis of 2007-2008.
The number of times the phrase “credit default swap” appeared in AIG’s annual 10-K report did something very unusual in the year before the implosion. In AIG’s 2003 report, to the best of my recollection, the phrase appeared once. In the 2004 report, it appeared twice, and twice again in 2005. In the 2006 report, it appeared three times.
Then, in the 2007 report, released in early 2008 but before the implosion, it appeared more than 100 times.
That was a yellow flag, in hindsight or otherwise.
Well, consider another large (massive, in fact) financial institution – the Federal Government of the United States.
A few weeks ago, to deafening silence, the federal government issued its own annual report for fiscal year 2019, as it has since 1998. A massive document, with highly complex financial statements and other reporting.
Our analysis of that report should be completed soon. It appears that the federal government’s financial condition deteriorated at a faster pace than in 2018. We will let you know when our accounting and financial analysis is complete.
But how about the words? The rhetoric?
Truth in Accounting’s “Data-Z” website offers a wide range of government financial, economic, and demographic statistics for local, state, and federal government entities. We have also included a “Rhetorical Analysis” section for the federal government. For now, that section simply reports word counts for the frequencies of various words and phrases appearing in Uncle Sam’s annual financial report over time.
Here are some quick takes based on those word counts.
Uncle Sam’s finances are still trending rapidly toward “unsustainability.” Back in 1998 and 1999, the report never mentioned the word “unsustainable.” The report's use of the word began to march significantly higher, however, as the report included lengthier and more pressing discussions questioning the future fiscal path of the United States under current law and policy. Last year, there were 16 mentions of “unsustainable,” the same as in 2018, but the upward trend is unmistakable.
The reliability of the reported results remains in question. The Government Accountability Office (GAO) delivered another disclaimer of opinion on the financial statements last year, as it has every year since the late 1990s. This is basically a “flunk” opinion, undermining the credibility of the reported results. Private sector companies most likely couldn’t survive two decades of disclaimer opinions on their financial statements, but our federal government has, at least so far. Here’s the number of times the word ”disclaim” appeared in the financial report since 1998.
As noted above, we should have our financial analysis of the 2019 financial report of the U.S. government completed soon. But some simple rhetoric analysis can provide valuable perspective -- and potential warning signs.
They weren’t just running on toilet paper
March 23, 2020
The Federal Reserve Board of Governors publishes a weekly statistical report titled “Factors Affecting Reserve Balances.” The report provides an accounting for the aggregate supply and uses for depository institution reserves at the Fed – their own “bank accounts.” The report also includes an aggregate balance sheet for the 12 Federal Reserve Banks, which now report total assets of nearly $5 trillion, as well as breakouts for balance sheets for the Reserve Banks individually.
The Fed revised the presentation of the financial statements in the latest release of this report, dated March 19. That release disclosed the statement “has been modified to consolidate certain line items in table 5.” Modifications include the consolidation of amounts previously reported as “loans,” which includes discount window borrowing, into the line “Securities, unamortized premiums and discounts, repurchase items, and loans.”
Table 5 in this report provides a balance sheet for each Federal Reserve Bank, and the Fed went on to explain that “This modification supports the Federal Reserve's goal, expressed in its statement on March 15, 2020, of encouraging depository institutions to use the discount window to help meet demands for credit from households and businesses, including needs related to the spread of the coronavirus.”
Previously, analysts could look at changes in the “Loans” line item at Reserve Banks and infer where large scale borrowing might be underway, including in which Reserve district.
But this wasn’t the only line item that appears to have been modified.
Federal Reserve Notes – paper currency, like $1 and $100 bills – are presented as liabilities on Federal Reserve Bank balance sheets. Up until the latest reporting week, they had been presented net of the amounts “held” by individual Reserve banks – basically, vault cash.
In the two weeks prior to the change in presentation, there was a sudden downdraft in notes “held” by the Reserve Banks – about $17 billion worth, much higher than the same weeks in recent years. This is consistent with a sudden new demand for cash – physical currency.
In the latest reporting week, you can’t see the change in notes “held” by the individual Reserve Banks, given the change in presentation. But you can see that amount for the Reserve Banks in total, in the very last table of the report, which summarizes collateralization requirements. After a $9 billion decline in the week ended March 5, and an $8 billion decline in the week ended March 12, the dollar amount of notes held by the Reserve Banks dropped $23 billion in the week ended March 19.
What will a $2+ trillion ‘stimulus’ deal do to Uncle Sam’s fiscal gap?
March 25, 2020
Today, the federal government has reached agreement on a massive spending deal purportedly designed to support the economy amidst the impact of a spreading pandemic.
Is that the only motivation? Can the federal government afford it?
We continue to analyze the recently released Financial Report of the U.S. Government for 2019 and expect to have our analysis of that report done soon.
For now, here’s a worrisome symptom from simple word counts for that report.
Beginning in 2010, the report began with a formal analysis of the “fiscal gap” challenge facing the federal government. This followed growing concern expressed in the report about the long-run sustainability of federal finances.
Granted, in the last few years, the whole world has flocked to U.S. Treasuries in a “flight to quality” – especially amidst crisis-like financial conditions in recent months. But what if the flock of birds changes its mind about how safe that beach is?
The “fiscal gap” discussions in the Financial Report of the U.S. Government are based on quantifying the combination of federal spending cuts and/or tax increases needed to keep the federal debt to Gross Domestic Product (GDP) ratio from a sharp future upward projected path, one deemed “unsustainable” by the report’s authors (as well as more than a few outside observers).
The calculated “fiscal gap” has been growing in recent years. The financial calculations for the fiscal gap are complex, and rest on debatable assumptions. But we can do some simple rhetoric analysis to provide some perspective.
The chart below is created with Truth in Accounting’s “Data-Z”database. It is based on the “Rhetorical Analysis” section we have developed for the federal section of Data-Z, which currently tracks the number of times given words or phrases appear in the Financial Report of the U.S. Government.
As we’ve previously reported, the use of the terms “unsustainable” and “disclaimer” have been on a sharp long-term uptrend in that report. But how about the “fiscal gap”?
The term “fiscal gap” appeared 27 times in 2010, rising to 45 times in 2019 – a 66 percent increase over a period when the number of pages in the report was basically flat.
News - Bill's Blog
‘Hard’ vs. ‘soft’ liabilities – and pandemics
March 30, 2020
The federal government has embarked on a massive borrowing and spending program amidst the economic, financial and human consequences of the coronavirus pandemic. As events proceed, we will learn more about ability and means by which the government will finance the fiscal and monetary initiatives.
The federal government’s financial condition has not been improving in recent years, and more than a few observers had already been raising more concern about the sustainability of federal finances, before the pandemic really arrived on the scene.
The people writing the federal government’s annual financial report have been part of that growing concern. As we’ve noted, the number of times the word “unsustainable” is used in the report has been marching significantly higher in the last decade as the report’s authors spill more ink for the questions and concerns about the sustainability of the federal financial path under current law and policy.
For example, that annual report has been including a regular discussion of what is called the “fiscal gap,” calculated as the combination of spending cuts and/or tax increases required to keep the debt to GDP ratio from unsustainably mushrooming in the future.
Those very-large numbers were alarming even before the coronavirus crisis hit, and the federal government has reacted in a way that suggests sustainability is not a question. We shall see.
For now, however, we simply note an interesting related feature of the annual report in the last two years. The report lists liabilities on the balance sheet, but also includes related disclosures discussing possible future spending obligations that are not included in formal liabilities.
In all of the financial reports for 1998 to 2017, the word “pandemic” did not appear. However, it appeared in the report covering fiscal 2018, which came out in early 2019, for the first time. It was repeated in the report for 2019, which came out a few weeks ago, in similar language:
Further, there are other risks, such as health pandemics, cyberattacks, military engagements, and economic crises, that could affect the federal government’s financial position and condition and its financial management in the future. These risks are not fully accounted for in the government’s long-term fiscal projections.
These are valuable cautionary notes.
How much did employment drop last month?
April 6, 2020
Last Friday, as it does the first Friday of every month, the Department of Labor’s Bureau of Labor Statistics (BLS) released the monthly report on employment in the United States. The widely-followed estimate for total payroll employment fell by 701,000 jobs, a massive one-month decline that significantly exceeded analyst expectations.
The monthly employment report includes two main surveys, however – the payroll survey, a survey of firms that led to the result above, and a survey of households, from which the unemployment rate is reported.
The household survey doesn’t just measure unemployment. It also includes an estimate for total employment, like the payroll survey. And historically (for example, amidst the recovery from the 1990-1991 recession) the household survey has provided a more reliable read on labor market conditions.
What did the household measure for total employment do last month? It fell by almost 3 million jobs, a nearly two percent decline in a single month, and a decline about four times as large as the decline in payroll employment.
Granted, the household survey tends to be more volatile than the payroll survey. But it still is worth watching, given the sampling and other issues affecting both BLS surveys.
Amidst the challenges in interpreting government financial results, given their accounting issues, it is also worth remembering that sometimes, we have enough of a challenge just counting heads.
Too-Big-To-Fail policies spread to states and cities
April 9, 2020
Today, amidst other contagious diseases, the Federal Reserve announced the creation of a new lending facility for state and local governments. The Federal Reserve, our central bank, serves as a “lender of last resort” – but normally, to banks and other depository institutions, not state and local governments.
For the new facility announced today, the “Municipal Liquidity Facility,” the Fed asserted the program was legally grounded in the emergency lending provisions of the Federal Reserve Act (Section 13(3)). These provisions were last used by the Fed for extraordinary lending to entities the Fed deemed “too big to fail” in the financial crisis of 2007-2009.
The new municipal facility announced today enables cities with populations over 1 million, counties with populations greater than 2 million, and all 50 states to develop “eligible issuers” through which Federal Reserve lending may be obtained. On these terms, based on the latest available Census data, there are 10 “too big to fail” cities – New York City, Los Angeles, Chicago, Houston, Phoenix, Philadelphia, San Antonio, San Diego, Dallas, and San Jose.
In the banking world, critics of policies supporting “too big to fail” institutions cite incentives arising from moral hazard problems. Institutions aware that extraordinary support from general sources can be available in hard times may not work as hard to manage themselves responsibly in the good times. They may also be prone to undertaking higher risk. This can actually be rational behavior, in the sense that rational means “self-interested,” if potential losses are socialized outside the organizations.
But the policies undertaken to feed the largest beasts may be less than fair, if they make responsible parties assume the cost of riskier and/or less responsible enterprises. And while the powers that be often stress they are trying to maintain financial stability, the regular exercise of bailouts arguably undermines financial stability – and the sustainability of government finances – in the long run.
How about those 10 “too big to fail” cities? How responsibly did they manage their financial affairs in the decade since the bailouts from the 2007-2009 financial crisis? What financial condition were they in before the latest crisis hit?
Looking across the 75 largest cities in the United States, the tendency is – the larger the city, the worse the financial condition, as indicated by Truth in Accounting’s latest “Taxpayer Burden” measure of the cities’ net financial position. Size is significantly (and negatively) correlated with financial health. At $17,000, the average “Taxpayer Burden” for those 10 cities is roughly three times the average for the other 65 cities.
In the “last resort,” central bankers should lend, at least in theory, to illiquid but solvent (positive capital) institutions. Note that Truth in Accounting’s “Taxpayer Burden” is a measure of net financial position, and it was negative (a “burden”) for all 10 of those too-big-to-fail cities.
How did these 10 cities do, financially, in the decade before the current crisis? These were good years, economically. Looking at the 65 cities who didn’t make the cut for the Fed’s new facility, they managed to truly balance their budget, in the sense that they kept accrual expenses below accrual revenue, nearly 90 percent of the time in the four latest fiscal years. But for those 10 cities, they abided by “balanced budget” principles only about half the time.
Those 10 cities also tend to be in larger states, where similar tendencies appear. State governments in larger states tend to be in worse financial condition than those in smaller states, and truly “balance the budget” less frequently.
The new Fed facilities will no doubt support state and local governments in a time of need. But the need for this extraordinary new central bank behavior may have been driven by expectations it would arrive as needed, undermining financial discipline and potentially socializing losses and directing resources through less-than transparent avenues outside of more politically-accountable fiscal policy arenas.
Looking ahead, the pricing and implementation of these new lending facilities deserve scrutiny.
March Madness still happened, just in April
April 22, 2020
Last weekend I participated as a judge for a great event – the “Fiscal Challenge.” This annual academic competition invites college teams from throughout the nation to develop and defend their plans for a sustainable fiscal path for the federal government of the United States.
Led by University of North Carolina professor Mike Aguilar, with financial support from the Peter G. Peterson Foundation, the Fiscal Challenge invites student teams to compete for one of four finalist positions. The finalists usually deliver their proposals in presentations in Washington DC. Amidst current pandemic conditions, however, this year’s competition was conducted virtually. Teams from Pace University, Montana State, an intercollegiate squad, and Notre Dame made it to the “final four,” out of more than 20 teams competing around the country.
The event went very smoothly, technologically, a credit to Aguilar and his colleague Brady Gingrich. At the outset of the competition, the students had an exciting visitor. David Walker, former Comptroller General of the United States and long-time champion of fiscal responsibility, dropped in to say hello, and offered encouragement and support.
Four solid presentations later, we had a winner, as judges Diane Lim (Penn Wharton Budget Model), Brian Riedl (Manhattan Institute) and I (Bill Bergman, Truth in Accounting) evaluated each team on four criteria, settling on the team from Notre Dame as the national champion.
Granted, for basketball fans, it was sad to miss March Madness this year. But the Fiscal Challenge has developed an intercollegiate competition based on another set of priorities, which arguably deserve as much or more attention as hoops.
Still, I’m reminded of the fabled run to the final four by the men’s basketball team at Loyola U. Chicago a couple years ago. What a wonderful team, characterized by hard work, defense, and unselfish passing and team play. I was reminded of them by the response of the Notre Dame team to one of my questions, after I asked them to discuss how they resolved any disagreements among themselves as they developed their final product. Team leaders emphasized how they were inspired by the overall goal, prioritizing that over individual achievement.
In that classic Loyola “Final Four” run a couple years ago, Loyola’s Sr. Jean (Jean Delores Smith), the 98-year-old team chaplain, had her days in the sun. Sr. Jean bobbleheads were going for $300 on Ebay.
A couple weeks ago, Sr. Jean, now age 100, cut an inspirational video for the campus amidst current events. One of her lines was “This is the strangest March Madness I’ve ever seen.”
Let’s hope next year’s Fiscal Challenge is near-normal. For that matter, I also hope the real fiscal challenge doesn’t threaten students, and the rest of us, more than it already is.
The ‘Phillips Curve,’ in the scriptures, anyway …
May 6, 2020
In economics, students learn about something called the “Phillips Curve,” which depicts an inverse relationship, at least in the short run, between inflation and unemployment. They also learn about the debate over this relationship, including Milton Friedman’s prophetic late-1960s analysis leading him to conclude the inverse relationship wouldn’t last.
Here’s a look at how many times the words “inflation” and “unemployment” appear in the annual Financial Report of the U.S. Government, every year since 1998. Any wagers on what this picture will look like after the next Financial Report of the U.S. Government comes out in early 2021, for fiscal (September 30) year 2020, and in coming years?
Moral hazard and state lockdown restrictions: A self-inflicted wound?
June 2, 2020
The term “moral hazard” refers to the tendency for insured parties to take more risk after they have insurance. The insurance industry has also made a distinction between “morale” and a stricter “moral” hazard, the former being a simple tendency to take more risk, and the latter being cases where the insured party may actually have an incentive to cause the loss for which they purchased insurance. In this context, moral hazard has sometimes been described as “a $5,000 garage rubbing up against a $10,000 fire insurance policy.”
Moral hazard issues drive concern about the public “safety net” for our banking system and financial markets. Deposit insurance, the Federal Reserve’s discount window, payment system guarantees and other tools advertised to stabilize the system can actually spark more risk taking, and arguably cause instability. The morale vs. moral hazard distinction can become important if market participants try to game the system and take big risks, so long as any gains can be privatized while losses are socialized. Moral hazard concerns become more acute the closer to insolvency a financial institution becomes, as “zombie” institutions with little to lose and much to gain take higher risks.
This perspective can inform public policy issues relating to public sector pensions. Many of them are dramatically underfunded and arguably insolvent, even as they continue to survive on a cash flow basis. High discount rates and aggressively risky investment portfolios may well be part of the morale hazard problem, particularly in states with stronger legal guarantees for public sector retirement benefits.
But here’s a speculation about an issue for moral hazard, not morale hazard, arising from recent events.
WalletHub recently released a study ranking the states on how severe their lockdown restrictions have been, since the onset of the coronavirus crisis. Looking across the 48 continental United States, there is a remarkably strong correlation with Truth in Accounting’s “Taxpayer Burden” measure of state financial conditions. States in better financial shape tend to have fewer restrictions, and troubled states tend to have more restrictions. In turn, a simple regression explaining state rankings on lockdown restrictions suggests unfunded retirement benefits and the share of the public workforce covered by collective bargaining agreements have significant relationships with how severe those restrictions are. More intensively unionized states tend to have more lockdown restrictions, even after controlling for how underfunded their retirement benefit plans are.
Those lockdown restrictions have had economic consequences, including consequences for general tax revenue. Why might states in the worst financial shape be working harder to slow down their economies right now?
Granted, correlation is not causation. States in bad financial condition also tend to be more congested, with higher urban populations. If lockdowns make sense, this may not be such a bad moral hazard problem.
But state and local governments in bad financial condition, and their friends in financial markets, might also be doing their best to impress the “guardians” of our federal fiscal purse how bad things are, with a view to getting bigger bailout packages. And the wounds may not be so self-inflicted, if some of the people paying the price right now are out in the streets, while taxpayers more generally pay a price in the future.
Federal Reserve lends directly to State of Illinois
June 8, 2020
In an astonishing and legally questionable transaction, the State of Illinois reportedly just borrowed $1.2 billion directly from the Federal Reserve Bank of New York. Illinois was the first to the table for the Fed’s new “Municipal Liquidity Facility,” which the Fed asserts is authorized by the Section 13(3) emergency lending provisions of the Federal Reserve Act. Section 13(3) is titled “Discounts for individuals, partnerships and corporations,” and includes provisions forbidding loans to borrowers that are insolvent. As a learned friend opined, ‘aliens from outer space should have access to the Fed’s discount window, if Illinois does.’
More thorough analysis to follow.
Is Illinois an ‘eligible issuer’ for new Fed lending?
June 8, 2020
On April 9, amidst plunging economic conditions, the Federal Reserve announced a set of lending policy initiatives that included a new “Municipal Liquidity Facility” for state and local governments. For legal authority, the Fed cited the emergency lending provisions in section 13(3) of the Federal Reserve Act.
Normally, a central bank lends to banks, but emergency provisions have historically been used by the Fed to justify direct lending to “individuals, partnerships and corporations” in “unusual and exigent circumstances.” Section 13(3) is titled “Discounts for individuals, partnerships, and corporations,” raising questions whether the Municipal Liquidity Facility is actually authorized under Section 13(3).
The new facility is unprecedented. It is available to cities and counties meeting population requirements, and all 50 states. Smaller cities and counties may be supported by state borrowing through the facility. The lending facility is operated by the Federal Reserve Bank of New York. The facility may lend as much as $500 billion.
The State of Illinois became the first entity to use the facility, under a transaction that closed last Friday.
To qualify as an “eligible issuer,” states, cities and counties must meet thresholds for credit quality as determined by credit ratings set by “Nationally Recognized Statistical Rating Organizations.” This provides a depressing reminder of lessons unlearned from the financial crisis of 2007-2009, with implications for the State of Illinois. Kind, benevolent, and well-paid credit rating agencies can issue ratings above thresholds for Municipal Lending Facility access, even for places like Illinois that may have debt trading with yields more characteristic of “junk” credit.
The facility’s term sheet published by the Fed includes criteria to make issuers eligible, but does not mention another factor central to lender of last resort activity, and required by federal law. Section 13(3) of the Federal Reserve Act, as amended, includes provisions purportedly designed to check the discretion and scope of Fed crisis lending. After the Fed’s widespread and massive lending amidst the financial crisis of 2007-2009, the Dodd-Frank Act included qualifiers forbidding lending to “borrowers that are insolvent.”
To implement this directive, the Federal Reserve Board is directed to develop procedures that may call for the borrower’s CEO or another authorized officer to certify that the borrower is not insolvent. Yet for the purpose of that provision, Section 13(3) defines “insolvent” to be one of three cases – the borrower is in bankruptcy, under resolution procedures in Title II of Dodd-Frank, or “any other Federal or state insolvency proceeding.”
Municipal governments aren’t banks, but it is difficult to escape the conclusion that the City of Chicago, Cook County, and the State of Illinois are all balance-sheet insolvent. Their assets are swamped by their liabilities. All three entities sport massively negative unrestricted net positions, the product of decades of spending beyond their means on an accrual basis despite advertised “balanced budgets.” But none of them are currently in bankruptcy or the other forms of resolution procedures called for in Section 13(3).
Federal statutes are not the only sources of authority for Fed emergency lending, however, with one implication for identifying responsibility (and discretion) at the Federal Reserve. The Fed issues its own regulations, under law, including Regulation A – Extensions of Credit by Federal Reserve Banks. Regulation A provides other criteria for determining whether a borrower is insolvent. They include whether the Fed finds that the entity “is generally not paying its undisputed debts as they become due,” and whether “the Board or Federal Reserve Bank otherwise determines that the person or entity is insolvent,” with the latter determination resting in part on a review of audited financial statements.
The State of Illinois is arguably not an “individual, partnership or corporation,” so how can it be the object of loans asserted to be authorized by a statute titled “Discounts for individuals, partnerships and corporations?” The State of Illinois has a $5.7 billion bill backlog, yet the Federal Reserve seemingly did not find Illinois “is generally not paying its undisputed debts as they become due.” The Fed apparently did not “otherwise determine that the person or entity is insolvent,” even as the State of Illinois’ latest annual balance sheet reported $267 billion in liabilities, “backed” by only $85 billion in assets – leading to a reported unrestricted net position of (negative) $214 billion. And the interest rate on the loan closed last Friday assertably lies well below what the market would have charged Illinois, despite the fact that Regulation A calls for a "penalty rate" for emergency loans.
The State of Illinois recently passed budget legislation that relied in part on billions of dollars in anticipated borrowing proceeds from the Federal Reserve’s Municipal Liquidity Facility. That lending has reportedly been expected to be repaid with uncertain proceeds from Federal aid from other places. So the value of the credit – and the risk to the Fed – appear to be conditioned with political risk.
Those concerned about the risks of politicizing monetary policy frequently stress that politicized lending decisions should not be undertaken by a monetary authority, but by fiscal authorities closer to the whip of accountable elections.
Traditional lender-of-last-resort theory cautions that central banks should restrict their lending to illiquid but solvent institutions. The City of Chicago and State of Illinois may not strictly be in bankruptcy or related resolution arenas yet, but they have been headed in that direction, and more than a few parties believe those proceedings can and/or should arrive down the road.
In banking, history cautions that failing institutions backed by a public safety net should be resolved sooner than later, under principles for what has become known as “prompt corrective action.” Absent timely intervention, which may take the form of forced mergers or even liquidation, insolvent failed firms can have incentives to gamble on the public purse, privatizing any gains while socializing losses.
So it may also go for many state and local governments and their massively underfunded pension funds. The Fed’s new Municipal Liquidity Facility can prop up failed enterprises with public resources, and through a vehicle fueled with a combustible mix of fiscal and monetary policy.
It looks like the State of Illinois is paying down its bill backlog!
June 12, 2020
In the last couple of days, I’ve been looking at the bill backlog webpage at the website for the Illinois State Comptroller. It seemed like the backlog amount had gone down from what I remembered. Using the Wayback Machine, we got that webpage for eight days in the last month and a half. Here’s the total general funds bill backlog reported for each of those days:
May 1
$ 6.8 billion
May 11
$ 6.8 billion
May 12
$ 6.6 billion
May 13
$ 6.5 billion
June 3
$ 6.9 billion
June 5
$ 6.9 billion
June 8
$ 5.7 billion
June 12
$ 4.8 billion
The June 5 backlog number was reported as of 8 a.m. CT. Something big happened later that day. Illinois secured a $1.2 billion loan directly from the Federal Reserve Bank of New York.
That loan has been asserted to be authorized under the emergency lending provisions of the Federal Reserve Act, titled “Discounts to individuals, partnerships and corporations.” In turn, Federal Reserve Banks’ lending is also governed by Regulation A of the Federal Reserve Board of Governors.
Among other questions, emergency loans are not supposed to be extended to insolvent borrowers, with language including that the borrower “has not failed to generally pay its undisputed debts as they become due during the 90 days preceding the date of borrowing under the program or facility.”
And a statement still on the Comptroller’s website today, dated April 3 (less than 90 days before June 5) included:
“The Illinois Office of Comptroller has received multiple inquiries as to the timing and volume of payments being released, given the circumstances related to the worldwide COVID-19 Coronavirus health emergency. Due to the severity of this impact, and the significant additional challenges it poses to the state’s finances, further payment delays are to be expected in the coming weeks and months.”
It's not like that bill backlog just flowered right after the pandemic arrived, however. It's been a longstanding problem. Back on December 30, 2019, it stood at $6.6 billion.
It seems ironic that Illinois appears to be paying down its bill backlog directly or indirectly with proceeds from a loan from the Federal Reserve Bank of New York, under these circumstances.
Illinois pays $2 billion in past due bills – to whom?
June 16, 2020
In the week from June 4 to June 11, the general fund backlog for the State of Illinois, reported at the Illinois Comptroller’s website, fell from $6.9 billion to $4.8 billion. That coincided with the delivery of the proceeds of an extraordinary loan to the State of Illinois from the Federal Reserve Bank of New York.
Yet law and regulation seem to imply that Fed emergency lending like this can’t be undertaken for insolvent borrowers, with past due bill backlogs explicitly identified as evidence of insolvency.
So it appears that Illinois is getting an emergency loan and paying down its bill backlog with it, even as law and regulation imply that the loan shouldn’t have been extended because of the bill backlog.
Further questions arise. For example, who received the $2 billion in payments? Is it possible it went to companies like this one?
I called the Illinois Comptroller’s office and noted the recent decline in the bill backlog. The representative said “yes, we’re making good progress there.” Then I asked who was paid and that was the end of the information line, at least so far.
You, too, can balance your budget by borrowing money
June 18, 2020
Nearly all of the United States have some form of balanced budget requirement for their state government, either through the state constitution or by state law. In theory, balanced budget requirements constrain governments from spending beyond their means, borrowing to make up the difference, and shifting the costs of government to future citizens and taxpayers.
In practice, however, the wording of legal requirements combine with accounting standards developed by the Governmental Accounting Standards Board (GASB) to render those requirements toothless, at best, in more than a few states (such as Illinois) that have dug massive holes in the unrestricted net position reported on their balance sheet.
I said “at best” for a reason. At worst, the advertised cure has helped spread the disease. Politicians can claim they balanced the budget and were responsible stewards, even as they run up the credit cards. The law and the accounting can grease the wheels for deceptive efforts to mollify the masses.
Today, a new document appeared at the State of Illinois’ Office of Management and Budget website, titled Fiscal Year 2021 Budget Highlights. The document included a table summarizing the “resources” (totaling nearly $43 billion) and “expenditures” (totaling $42.9 billion), leading to general funds “surplus” of $87 million.
But look closely at those resources. They include, as authorized under GASB standards, a line item called “Federal Stabilization/Municipal Liquidity Facility,” and another item called “P.A. 101-0008 Revenues/Section 7.6 GO Bond Borrowing.” These two items each have their own two items, for important reasons.
The “Federal Stabilization/Municipal Liquidity Facility” line anticipates $5 billion from either federal aid or, if that doesn’t arrive, borrowing proceeds from legally questionable loans from the Federal Reserve Bank of New York. The “P.A. 101-0008 Revenues/Section 7.6 GO Bond Borrowing” line anticipates $1.3 billion either from higher income tax revenue if a state constitutional amendment passes or, if that doesn’t arrive, proceeds from issuing more bonds.
In other words, Illinois can have a surplus, and balance its budget, by borrowing money! This oxymoron is brought to you by funds accounting practices authorized by the GASB.
Back in August 2019, David Crane and George Schultz penned a prophetic op-ed in the San Francisco Chronicle, titled “It’s Time for Truth in State and Local Government Finances.” They argued that "The next recession will expose those state and local governments that have used GASB's permissive rules to cover up deep financial problems, potentially forcing the federal government to step in to finance core public services."
Now, here we are.
Migration trends – Illinois and its ‘touchy-feely’ neighbors
July 1, 2020
We just updated some state migration data in Truth in Accounting’s “Data-Z” database. The updates included net population migration (inmigration minus outmigration) estimates from the U.S. Census Bureau.
Illinois isn’t faring very well.
Here’s a look at Illinois vs. some of its next-door-neighbor states in how they rank on net migration compared to all 50 states from 2011 to 2019. Illinois has ranked 48th, 49th or 50th in all these years, while the average ranking for its touchy-feely (and possible destination choice) neighbors Indiana, Missouri and Wisconsin has fallen (improved) from 40th to 25th. (Higher is worse in this ranking.)
The chart above is based on state rankings. Here’s a look at the raw data leading to those rankings. It shows the net amount of migration (per 1,000 residents) for the same four states. Indiana, Missouri, and Wisconsin have been improving and moving from negative to positive migration rates. Illinois, on the other hand …
In turn, here’s a similar-looking picture, but based on state government financial conditions. It shows Truth in Accounting’s “Taxpayer Burden” measure for the same states, since 2009.
Illinois’ government debt load is getting heavier and weighing on a smaller pool of residents.
The good news: The City of Chicago only lost $94 million last year
July 6, 2020
Late last week, the City of Chicago released its annual financial report. The report was a good news, bad news story. The good news was that the city only lost $94 million. This may not sound like good news, but the silk purse from the sow’s ear arrived as the city’s losses fell significantly in 2018 and then in 2019.
From 2010 to 2014, the city’s losses averaged more than $1 billion a year, even as the city asserted that it balanced its budget every year as required by state law. Then in 2015 and 2016, some really gruesome results arose, as accrual expenses exceeded fee, grant and general revenue by $9 billion for those two years taken together. In 2017, some semblance of normalcy arrived, at least as far as a $940 million loss can be seen as “normal.” Then, the losses fell to $438 million in 2018, and again to $94 million in 2019, the first year of the Lightfoot administration.
That’s the good news. But what’s good for the goose isn’t always what is good for the gander.
The improvement in the bottom line in 2019 arrived despite overall expense growth accelerating from 2018. Losses fell simply because tax revenue rose significantly faster than expenses. And the really bad news was that the city’s overall financial position continued to deteriorate amidst favorable economic conditions, in a year that ended more than six months ago. Since then, the onset of a severe recession has damaged city revenue sources significantly.
Here’s a look at Chicago general revenue – basically, tax revenue – in the last ten years (including 2019). You can see an acceleration in general revenue growth, particularly last year.
So far, it appears that Chicago has found a way to squeeze more blood out of a smaller and smaller number of stones. Here’s a look at Chicago’s population over the last ten years.
In turn, dividing general revenue by population, you get a rough picture of the city’s tax burden on the remaining population.
Then, the pandemic arrived.
We will be digging deeper into Chicago’s latest annual report and will release our updated “Taxpayer Burden” measure of the city’s financial position soon.
Governor JB Pritzker certifies that the State of Illinois is ‘not insolvent’
July 8, 2020
In early June, the State of Illinois obtained a $1.2 billion loan directly from an extraordinary Federal Reserve lending facility. The Fed asserted the loan was authorized under Section 13(3) of the Federal Reserve Act, which is titled “Discounts for individuals, partnerships, and corporations.” These emergency provisions make direct Federal Reserve credit available to a wide variety of parties that normally don’t have access to the Fed’s discount window, under “unusual and exigent circumstances.”
One question arises whether a sovereign state qualifies as an “individual, partnership, or corporation,” for the purpose of qualifying for a massive loan like this. Another question arises due to other provisions in law and regulation that deny 13(3) loan eligibility to “insolvent” borrowers. Those provisions include a requirement that the CEO or other authorized officer certify that the borrower is not insolvent. Under Federal Reserve regulations, the entity is “insolvent” if the “person or entity is generally not paying its undisputed debts as they become due during the 90 days preceding the date of borrowing under the program or facility.”
Illinois has had a bill backlog in the billions of dollars in recent years. And from May 1, 2020 to June 5, the date the Fed loan closed, the backlog exceeded $6 billion. Then, over the next week, after the loan was secured, the bill backlog fell about $2 billion -- after the arrival of the proceeds of a loan that appears to be against law and regulation in light of the bill backlog.
Today, I received a formal certification letter from the State of Illinois in response to a FOIA request. The letter is titled “Certification Regarding Solvency and Adequate Credit,” and is signed by JB Pritzker, Governor of Illinois. Pritzker certified that “the Issuer is not insolvent,” with a footnoted reference that reads as follows:
For the purposes of this certification, a person or entity is “insolvent” if it is in bankruptcy or any other Federal or State insolvency proceeding (as defined in paragraph B(ii) of Section 13(3) of the Act), or if the person or entity was generally failing to pay undisputed debts as they become due during the 90 days preceding the date of borrowing under the Facility.
I’ve received a response to another FOIA request to the State of Illinois recently. I requested a list of all the payments the State of Illinois made from June 4 to June 11, the period when the bill backlog fell by more than $2 billion, but still totaled $4.8 billion as of June 12. I now have a spreadsheet with more than 15,000 individual payments made by the State of Illinois in that week, totaling more than $2 billion. The payments data includes the “voucher date,” the “payment date,” the identity of the recipient, and the amount of the payment.
Analysis of those 15,000 payments is underway. So far, I haven’t seen direct evidence of payments to specialized firms involved in “factoring” late payments. But the payments could be made to parties who then remit money to the factoring firms, after those firms fronted the money to the party awaiting payment from Illinois. Some of these factoring firms have reportedly been under scrutiny.
You can pay me now, or pay me later
July 15, 2020
"You can pay me now, or pay me later."
That was the closing line in a classic TV ad for Fram Oil Filters back in the 1970s. So it goes with taxes and governments (like the State of Illinois) that choose to “balance their budgets” with borrowing proceeds.
Today is Tax Day! To celebrate, consider the relationship between the “tax burden” calculated by WalletHub, and the “Taxpayer Burden” calculated by Truth in Accounting (TIA).
WalletHub does a lot of digging to find property taxes, individual income taxes, and sales and excise taxes for all 50 states, and expresses them as a share of total personal income in the state. This is a flow measure of tax burden, which is based on current tax payments.
Truth in Accounting also does a lot of digging, but into balance sheets and related statements relating to current financial position. TIA’s “Taxpayer Burden” starts with liquid assets, subtracting all debts (including government employee retirement benefits), and expresses the remainder on a per-taxpayer basis.
Both measures are valuable, but for different and related reasons.
In WalletHub’s latest ranking, for example, Illinois had the 9th highest taxburden among the 50 states. In Truth in Accounting’s latest ranking, on the other hand, Illinois had the 2nd highest Taxpayer Burden.
Who’s right? Both of them as they are measuring similar but different things. But consider the forward-looking implications of TIA’s measure. A given state (like Illinois) may rank high on WalletHub’s tax burden measure, but not high enough if that state (like Illinois) still chooses to under-tax its population compared to expenses, funding the difference with borrowing proceeds that have to be repaid later.
You can pay me now or you can pay me later! “I don’t cost that much,” the first guy selling the Fram Oil Filter says. Followed by “But I do!” the second guy fixing an engine says.
Why are 22 states suing the U.S. Department of Education?
July 16, 2020
On July 15, 22 states sued the U.S. Department of Education (DOE) for changes made to student loan anti-fraud rules and related rules for for-profit colleges. The new DOE rules make it harder for borrowers to qualify for loan forgiveness when students assert they were defrauded.
The 22 states include California, Colorado, Connecticut, Delaware, Hawaii, Illinois, Maine, Maryland, Massachusetts, Michigan, Minnesota, Nevada, New Jersey, New Mexico, New York, North Carolina, Pennsylvania, Rhode Island, Vermont, Virginia, and Wisconsin.
I just compared the average ranking of those 22 states to the average ranking of the rest of the 50 states on five variables of interest that we maintain on Truth in Accounting’s “Data-Z” database. There are significant differences between those 22 states and the rest of the states on each of these variables.
Ranked from the least significant difference (at the top of the list) to the most significant difference (at the bottom of the list), those five variables are:
Those 22 states suing DOE tend to have higher student debt than the other states.
Those 22 states suing DOE tend to have state governments in worse financial shape.
Those 22 states suing DOE tend to have more lawyers per capita.
Public Sector Workers Covered by Collective Bargaining Agreements
Those 22 states suing DOE tend to have a higher share of unionized public workers.
U.S. House Election Vote Percentage (Dem.)
In the most significant difference, those 22 states suing DOE tend to vote Democratic.
Can citizens benefit from ‘value investing’ analysis of their governments?
July 29, 2020
We are looking forward to hosting Paul B. Kazarian in Truth in Accounting’s next “Ask The Experts” webinar on August 4. Kazarian is Chairman and CEO of Japonica Partners, an investment firm. He also founded and leads the Charles and Agnes Kazarian Foundation, a nonprofit with a mission to “improve public financial management and financial literacy.”
In a recent debate hosted by Columbia Business School, Kazarian laid out a strong case, shared by Truth in Accounting, that cash-accounting based performance metrics and traditional measures of government debt and deficits can lead to misleading -- and overly optimistic -- communications received by citizens and taxpayers.
The Kazarian Foundation website includes a glossary outlining the “Citizens Wealth” framework they have developed to analyze government financial performance. I appreciate how that framework frames government financial conditions not in terms of the government as the end, but as the means to the end. We have a government of popular sovereignty in the United States. The financial condition of the U.S. government matters most importantly not to the government, but to the people it serves.
Their glossary introduces the “Citizens Wealth” framework in the following terms:
Citizens’ Wealth is a per person government performance (track record) indicator that provides significantly better historical and comparative insights into the relationship between the total economy GDP and Total Government Balance Sheet (especially when compared to GDP or a debt to GDP ratio). The CW government performance indicator disrupts obsolete and financially destructive conventional thinking …
In turn, they identify the roots of their concern with traditional cash-based measures of government deficits in terms near and dear to our hearts at Truth in Accounting:
Simply put, the debt and cash deficit framework is both chronically flawed and massively value destructive in part because it enables corruption and mismanagement. In point of fact, for massive and highly complex organizations (unlike households or small businesses), cash-based fiscal balances (i.e., cash deficits) provide vastly more flexibility to create fiscal illusions than do numbers calculated in accordance with international accounting standards.
Kazarian lists Graham & Dodd’s classic “Security Analysis” book among his foundational readings, and he was recently interviewed in the Winter 2020 edition of the “Graham & Doddsville” quarterly newsletter from Columbia Business School. He characterized Japonica’s investment philosophy in these terms:
Japonica's transformational investments have three building blocks: discover systemic misconceptions, discover a massive undervaluation, and create extraordinary value. Discover systemic misconceptions rooted in financial statements (especially balance sheets), which do not reflect economic reality.
In turn, in that Columbia Business School debate, Kazarian listed “five misconceptions that are perpetuating the broken debt and deficit model.” One of them was “US government is a global benchmark in financial performance.” In turn, he has also stated:
Over the past eight years, we’ve met with or analyzed the research of the so-called best investors in sovereign bonds. The financial research and analysis we found was so deficient that if done by a professional equity manager, they would be criminally guilty of gross negligence and more likely recklessness.
We are looking forward to our conversation next Tuesday, and hope you are too. Audience participation in the Q&A is encouraged.
New Zealand 74, USA 6
July 30, 2020
That was the score the last time the United States national rugby team played the New Zealand "All-Blacks."
The "All-Blacks" set the standard on the rugby pitch. New Zealand's government does the same thing on the financial field.
New Zealand is about 6,700 miles southwest of San Diego, and about 4,600 miles southwest of Hawaii. This far-away place deserves a close look because it provides a good benchmark for government financial performance, and positive lessons about public sector accounting practices.
One way to score how the United States fares compared to New Zealand, financially, is through the “Citizens Wealth” framework developed by the Kazarian Foundation for measuring and tracking government finances. Their “CW1” summary statistic nets country GDP against total government net worth (assets less liabilities, with the net amount either positive or negative) on a per-capita basis.
From 2011 to 2019, New Zealand’s “Citizens Wealth” grew from a positive $52,000 to $60,000. Over the same time frame, the average the Foundation computed for a composite of “AAA” rated governments (including Australia, Canada, Sweden, Switzerland and the United States) fell from a positive $51,000 (in 2011) to $43,000. This $8,000 per-person decline -- amidst favorable economic growth -- was a mirror image of the $8,000 increase in New Zealand.
How does the United States perform? In a chart presented at a recent debate hosted by the Columbia Business School, Paul B. Kazarian showed what they calculated for Citizens Wealth in the United States. Their measure for the United States fell $25,000 (per person) from 2000 to 2019, a period when it rose by $45,000 (per person) in New Zealand.
You can see a summary of their calculations here.
We will be hosting Paul B. Kazarian in a live webinar next Tuesday at 11:30am CT. Our discussion will include understanding how New Zealand can serve as a role model, including how their leaders developed accounting principles supporting responsible financial management. You can register for the event here.
How big is your federal government? How many programs does it run?
August 5, 2020
I just completed a report on efforts to have the federal government complete an accounting project Congress called for years ago. My report is titled "The Federal Program Inventory: Rehabbing a Long-Lost Train Wreck." The report describes what a federal program inventory is, why many members of Congress believe it is needed, and the history of efforts to get a good inventory finished. The report concludes with a recommendation to give the lead role to the U.S. Government Accountability Office (GAO).
Back in 2010, Congress passed something called the GPRA Modernization Act. “GPRA” stands for “Government Performance and Results Act,” a law Congress passed in 1993 to address waste and inefficiency in federal government.programs. That 1993 law included a goal to “improve congressional decisionmaking by providing more objective information on achieving statutory objectives, and on the relative effectiveness and efficiency of federal programs and spending,” among other stated purposes.
The 2010 “Modernization Act” tried to beef up the 1993 framework, and included a directive to the Office of Management and Budget (OMB), which is in the executive branch, to lead the development of a website with “information about each program identified by the agencies.” That directive was included in a section titled “Transparency of programs, priority goals, and results.” Among other goals for that website, Congressional leaders cited a desire to reduce duplicative and wasteful federal spending.
But over time, some leaders in Congress and elsewhere have expressed concern that the OMB and the executive branch haven’t lived up to the letter and the spirit of the laws calling for what is now called a Federal Program Inventory.
Here's a mid-2019 press release from the United States Senate Committee on the Budget announcing the delivery of a letter from 17 Senators to OMB expressing concern about the lack of progress on this score. Here's a copy of that letter.
My report documents some of that history, describes how a successful inventory could make a valuable contribution, and makes some recommendations, including a fundamental recommendation that Congress abandon efforts to have OMB lead the inventory, and to put it in the hands of the GAO. My report also includes a thorough chronological bibliography of resources on the issue, including articles and reports from Congress, the GAO, the OMB, other executive branch agencies, think tanks, and the general media. Click here to view the full report.
Illinois, New Jersey and New York rank in bottom five in ALEC’s latest Economic Outlook Rankings
August 24, 2020
The American Legislative Exchange Council (ALEC) is out with its latest annual “Rich States, Poor States” report. This report analyzes all 50 states using 15 policy variables for regulation, labor relations, taxes and government spending. It computes an “Economic Outlook Ranking” for the states reflecting ALEC’s preferences for lower taxes, lower spending, lower regulation and reduced union power in labor markets. That’s their “bias,” but the proof does appear to be in the pudding when looking at migration trends across the 50 states in the last decade.
Here’s one isolated comparison between Illinois and Indiana. Since 2008, Illinois has consistently ranked in the bottom 10 states on ALEC’s Economic Outlook Ranking, and its ranking has deteriorated in the last five years. Indiana, on the other hand, has been in the top 10 on their rankings in the last five years and showed significant improvement since 2008.
Over the last decade, Illinois and Indiana have been like night (Illinois) and day (Indiana) on migration trends. For example, here’s a chart (also from Truth in Accounting’s Data-Z website) showing the share of outbound shipments in total interstate moving shipments as reported by United Van Lines, one of the largest moving companies in the United States.
Illinois and New Jersey have ranked last and second-to-last, respectively, on the United Van Lines migration results in recent years. They also rank second-to-last and last, respectively, on Truth in Accounting’s “Taxpayer Burden” measure of state government financial condition, and they were both in the bottom five states on ALEC’s latest Economic Outlook Rankings.
Since 2011, Illinois, New Jersey and New York have all been ranked in the bottom five states on outbound moves (most outbound migration) in the United Van Lines results.
A used book illuminates the rising cost of Illinois government
August 25, 2020
I’m on a cool project researching the career of Paul Douglas, a former economics professor at the University of Chicago (1920s to 1945), enlisted Marine (World War II), alderman on the Chicago City Council, and United States Senator from Illinois (from the late 1940s to the 1960s). The "liberal" Douglas preached (and practiced) fiscal responsibility. He warned against inflation, and fought against government corruption and corporate welfare. In his academic work, Douglas produced prodigious statistical studies of labor markets, and was putting together his own price indexes before modern computers existed.
A few months ago, I picked up a very-good-condition used hardback edition of Douglas’ memoirs, In the Fullness of Time (1971). Today, on page 261, I found a pleasant surprise – the mail order sales receipt for the book when it was new, from Kroch’s & Brentano’s, a legendary downtown Chicago bookstore.
The sale price for the book on the receipt was $13.50, the same amount shown at the top of the front jacket. Right below that was the sales tax – 68 cents.
Sixty-eight cents divided by $13.50 gives you the sales tax rate at the time – 5 percent. I bought this early-1970s book used a few months ago for $20. The picture below shows what a manager at Half-Price Books (a great place, also in Cook County, Illinois) showed me what a $20 book would really cost me today, including sales tax -- $21.95.
$1.95 divided by $20 equals the sales tax rate today (also in Cook County, Illinois) – 9.75 percent. In other words, the sales tax rate has almost doubled since the early 1970s. And we aren’t talking about sales taxes doubling, we are talking about the sales tax rate – sales taxes go up with inflation, even if the sales tax rate stays the same, so this can amplify the deterioration in the “cost of living.”
For a more apples-to-apples comparison, compare the cover jacket price for Douglas’ memoirs when new ($13.50) to the cover jacket price for Michelle Obama’s recent memoirs ($32.50). On that basis, 68 cents in sales tax in the early 1970s grows to $3.17 today.
So the cost of buying a new memoir, at least, just the book, went up 2.4 times from the early 1970s to today, while the cost of the 'right' to buy the book – the sales tax – went up 4.7 times, almost twice as fast as the cost of the “thing” itself.
This simple example illuminates some interesting issues in the federal government’s accounting for inflation, as well as economic growth. For one thing, consider how the Consumer Price Index (CPI) deals with sales taxes. The Bureau of Labor Statistics (the BLS, in the United States Department of Labor) calculates the CPI. The BLS asserts:
Taxes that are directly associated with the purchase of specific goods and services (such as sales and excise taxes), as well as government user fees, are included in the CPI.
That’s true, but how are those taxes included? In the cost of goods and services that are taxed, not as a cost of government. The BLS does not include the “cost of government” in the CPI – even as our national economic statistics include “government” among the four main components of Gross Domestic Product (Consumer Spending, Investment, Government Spending, and Net Exports).
If it is good for the goose, is it good for the gander?
In 1952, while a US Senator, Douglas produced a book titled “Economy in the National Government.” The concluding chapter was titled “The Budget Must Be Balanced.” Regarding the role of government in the economy (and including government spending in GDP), Douglas was far from a blind advocate for government spending. He noted that “tax moneys are taken from individuals and corporations which, as a result, have less money to spend, save or invest.”
We should always remember that money not spent by the government could normally be spent by individuals, and we should compare the benefits of public expenditures with the unseen benefits which would have resulted from the private expenditures which were foregone.
Speaking of blind advocates, Douglas’ messages about fiscal responsibility and corruption in government should not be lost on Illinoisans, including Illinoisans promoting “multiplier effects” asserted for pension benefits on the Illinois economy -- and the cost of buying used books.
Crises, lobbying, and migration: Lessons from 2009 for pandemic/lockdown bailout debates
August 27, 2020
When crises arrive, lobbying activity intensifies. When lobbying activity intensifies, it can impact migration trends, especially for Washington, DC. Given the current pandemic/lockdown crisis and calls for more federal “relief,” we may learn some lessons about the fruits of lobbying labor from 2009, when we had one of the worst financial and economic crises in U.S. history.
There are a variety of sources for tracking migration trends within the United States. The Internal Revenue Service (IRS) provides some of the most detailed data available. Their migration statistics are based on tracking income tax returns filed by zip code. IRS datasets include total outmigration and inmigration by state, as well as individual state-to-state outmigration and inmigration for all 50 states (and Washington, DC). The latter dataset allows you to assess what state people are going to when they leave a given state, as well as what state people came from when they filed in a new state, annually.
Looking at the net migration flows for DC vis a vis the states provides some pretty interesting results. (Alaska, Hawaii, and DC neighbors Maryland, Virginia and Delaware are excluded from the observations below.)
From 2005 to 2008, DC took in about 2,000 to 3,000 more tax filers than it lost to all the other states. Then, in 2009, amidst the financial and economic wreckage and associated premium on lobbying activity, net migration to DC surged from 2,215 to 4,392 filers.
When comparing all the states on the net migration from those states to DC in 2009, there is an interesting and possibly disturbing pattern. States with higher net migration flows to DC in 2009 tend to be a) states with governments that were in relatively bad financial shape in 2009, and b) states with governments whose financial condition deteriorated more from 2009 to 2018. Those results hold both for total net migration to DC, as well as net migration as a share of the total state population.
What could be driving the bus on this result? One is tempted to conclude that states with more net migration to DC in 2009 have populations with tighter connections to governmental financial levers. The term “rent-seeking” has been developed in political economy to describe a process whereby the pursuers of profit do their best to succeed not only in the marketplaces where they serve their customers, but in the political arena, carving out favorable legislation, regulation, and bailouts. In turn, the public purse in states with higher “rent-seeker” concentrations may be more vulnerable to similar forces within those states.
Who are the states with the highest (and lowest) net migration to DC in 2009?
Dividing the 45 states (excluding Alaska, Hawaii, Maryland, Virginia and Delaware) into five buckets of nine states apiece, here’s a look at the average Truth in Accounting (TIA) Taxpayer Burden for 2009 for the five buckets of states ranked (highest to lowest) on total net migration to DC in 2009:
Here’s a look at the deterioration in TIA’s Taxpayer Burden from 2009 to 2018 for the state buckets when ranked on total net migration to DC.
A future report will take a closer look at the characteristics of the states in Bucket Number 1 and Bucket Number 5. For now, here’s a look at the average number of lawyers per 10,000 residents for each of those five categories of states.
Lobbying involves lawyers. Maybe it’s a coincidence, and other factors are at work, but states with high net migration to DC in 2009 tend to be more lawyer-intensive states.
We will not have 2020 IRS migration data for a year or two, but that will be interesting to see when it comes out.
Congressional Oversight Commission to scrutinize Fed’s ‘Municipal Liquidity Facility’ in upcoming hearings
August 31, 2020
Earlier this year, Congress passed the “CARES” Act, which stands for the Coronavirus Aid, Relief, and Economic Security Act. In the legislation, it also created an oversight commission to monitor actions taken by the government, including the Federal Reserve, in implementing the Act. This commission issued its fourth report on August 20, which included a disclosure that the commission will be holding hearings about the Federal Reserve’s new “Municipal Liquidity Facility” (MLF) in the coming weeks.
To date, two borrowers have surfaced for the Fed’s MLF – the State of Illinois, and New York’s Metropolitan Transit Authority. Hopefully, the commission hearings will take a close look at both of these transactions, including whether they comply with Section 13(3) of the Federal Reserve Act, as well as the Federal Reserve’s “Regulation A.”
From an article I wrote back in June:
The State of Illinois is arguably not an “individual, partnership or corporation,” so how can it be the object of loans asserted to be authorized by a statute titled “Discounts for individuals, partnerships and corporations?” The State of Illinois has a $5.7 billion bill backlog, yet the Federal Reserve seemingly did not find Illinois “is generally not paying its undisputed debts as they become due.” The Fed apparently did not “otherwise determine that the person or entity is insolvent,” even as the State of Illinois’ latest annual balance sheet reported $267 billion in liabilities, “backed” by only $85 billion in assets – leading to a reported unrestricted net position of (negative) $214 billion. And the interest rate on the loan closed last Friday assertably lies well below what the market would have charged Illinois, despite the fact that Regulation A calls for a "penalty rate" for emergency loans.
Yes, Illinois is an ‘extreme outlier’
September 1, 2020
An article in Barron’s yesterday was titled “Is Your State in Financial Trouble? Here’s how all 50 stack up.” It included an analysis of states’ creditworthiness by the asset management company Eaton Vance. A table in the article included at least one noteworthy data point – the spread on state bond yields over a municipal bond AAA benchmark yield.
Here’s a look at those spreads for all 50 states. The higher the spread, the higher the market perceives the credit risk. Illinois, an “extreme outlier,” is over there at the far right, at more than 200 points over the benchmark – three times as large a spread as New Jersey and Kentucky, the states with the second and third highest spreads, respectively.
In a new analysis by Wirepoints, Illinois was called an “extreme outlier” in part because its credit rating had fallen to “one notch above junk, with a negative outlook.” Have the credit rating “agencies” been overly charitable, as in the (recent) past? How did the Federal Reserve deem Illinois an “eligible issuer” for its new Municipal Liquidity Facility, even as federal law and regulation deny Fed emergency lending to “insolvent” borrowers?
Cleaning up nuclear contamination costs a lot of money – and the costs are mushrooming
September 10, 2020
The federal budget gets a lot of attention, while the federal government’s annual financial report with audited financial statements goes widely ignored. People who care about how the government plans to spend our money apparently outnumber the people who care about how the government accounts for its spending.
The budget deficit does get attention, with estimated amounts widely reported. But the annual financial report includes a valuable companion – something called “net operating cost.” The widely-reported budget deficit is based on cash-like accounting principles, while net operating costs add significant incurred (and accruing) expenses that don’t involve cash currently going out the door -- posing future consequences.
The federal government’s net operating cost significantly exceeds the budget deficit. In 2018, when the budget deficit was reported at $779 billion (negative), the net operating cost ran nearly 50 percent higher, at $1.2 trillion. The net operating cost then rose 25 percent – to nearly $1.5 trillion – in 2019.
What accounts for the difference between the net operating cost and the budget deficit? The annual financial report cites non-cash changes in three main liabilities – employee and veteran benefits payable, insurance and guarantee program liabilities, and “environmental and disposal liabilities.”
Let’s take a peek at those environmental and disposal liabilities – in total, not in the annual (non-cash) change in the estimated debt.
What’s in this stuff? Lots and lots of icky things that entail future cleanup costs, primarily for environmental contamination relating to nuclear weapons testing dating back to World War II. At almost $600 billion in 2019, the dollar amount has nearly doubled since 2010.
And the $600 billion might be viewed as a lowball estimate, in light of the following cautionary note in how the government explains how it accounts for this liability: “Where technology does not exist to clean up radioactive or hazardous waste, only the estimable portion of the liability (typically monitoring and safe containment) is recorded.”
Should the federal government double down on financial assistance for states? What if it can’t?
September 15, 2020
In recent months, debate has heated up over whether the federal government should double down on assistance for state and local governments. The pandemic and associated lockdowns have adversely impacted tax revenue, amidst accelerating challenges in some states facing the consequences of decades of financial mismanagement.
That’s an important debate, but should we simply question whether and how the federal government could actually do this?
If you thought Illinois, New Jersey and other challenged states had pension problems, you might want to take a look at Uncle Sam.
The chart below shows the federal government’s debt for “employee and veteran benefits payable.” From 2008 to 2019, that debt rose 60 percent, climbing from $5.3 to $8.4 TRILLION.
Expressed on a per-income tax filer basis, Uncle Sam is in even worse shape than Illinois.
Granted, Uncle Sam has one thing Illinois doesn’t have -- the power to print money to pay off its debts. That may be good for Uncle Sam, but whether that is good for America is another matter.
The scariest zombie state governments walking among us on Halloween
October 27, 2020
This Halloween, we are resurrecting our “Zombie Index” to identify some scary state governments.
Who are the biggest zombies?
1. Illinois
2. New Jersey
3. Massachusetts
4. Connecticut
5. California
6. Texas
These state governments are in relatively bad financial condition and may also pose higher risks to their citizens and taxpayers from “gamble for resurrection” investment policies, on top of the financial burden they have already accumulated.
The index is inspired by the work of Edward Kane, a professor of finance at Boston College. Kane wrote books warning about the developing crisis in the bank deposit insurance system in the late 1980s, before and during the savings and loan crisis.
Kane coined the term "zombie bank" to refer to banks and thrifts that were effectively insolvent but allowed to remain open, in part with deceptive accounting.
Kane called these banks "zombies" as they were really dead but allowed to walk among the living. False accounting delayed loss recognition and regulatory intervention. The possible socialization of losses through the government safety net for banking firms gave zombies incentives to take large risks -- particularly if insiders gathered any upside but taxpayers would take the downside.
Zombies had incentives, in Kane's words, to "gamble for resurrection." These incentives amplified the cost of resolving the savings and loan crisis to taxpayers.
Today, similar incentives could be at work in state and local governments, particularly those with sorely underfunded pension plans. Citizens and taxpayers may be threatened by risky investments in those plans, similar to how they paid a price for risky assets in thrifts.
For further background on Kane’s analysis, see his 1989 article “The High Cost of Incompletely Funding the FSLIC Shortage of Explicit Capital.” For a timely and relevant recent article, see “The Risks of Public Pension Systems Reaching for Higher Investment Returns” by Jen Sidorova. You can view how we constructed the Zombie Index at the glossary entry at our Data-Z website.
David Walker pens valuable new warning about federal government finances
October 29, 2020
David Walker, former comptroller general of the United States, has written a new book titled “America in 2040: Still a Superpower?”
Bill Owens, retired Navy Admiral and former Vice Chairman of the Joint Chiefs of Staff, introduces the book with a useful foreword. Owens cautions that current events have been distracting us from addressing the most important challenges facing the nation today, first among them the financial condition of the federal government. Under current (and intransigent) law and policy, interest payments on the national debt are likely to mushroom in the years ahead, posing threats to taxpayers as well as recipients expecting future federal spending, including Social Security and Medicare.
Owens underlines Walker’s concerns about the longer-term consequences of Federal Reserve monetary policy in recent years, and also highlights Walker’s critical review of the structure, management and finances of the U.S. Department of Defense. He “concludes” his introduction with a second for Walker’s motion that we adopt an amendment to the U.S. Constitution to stabilize the national debt, and labels the debt burden “our greatest national security threat.”
On the latter point, Walker expresses concern that rapid future growth in entitlement spending, interest on the national debt, and a declining value of the U.S. dollar will threaten the funding for the Department of Defense. He calls for significant downsizing of the Pentagon bureaucracy and organizational and procurement reforms to provide “the best possible capability for the defense dollar.”
Coupled with the implicit message in the book’s title, one might question whether the end justifies Walker’s recommended means. Pursuing and maintaining “superpower” status might also be viewed as imperial overstretch, with related military spending one source of the deterioration of overall federal government finances.
Walker does not let state and local governments go unscathed. In terms near and dear to our hearts at Truth in Accounting, he lambasts municipal budgeting practices and misleading claims to balanced budgets. He cites how 49 of the 50 states have balanced budget requirements,
“While you might think that such a requirement would ensure that states do not get into financial trouble, such is not the case. Why? Because of the way most states define a ‘balanced budget.’ Most define it according to a cash basis of accounting rather than an accrual basis. As a result, states just need to ensure they have enough cash to make required payments for the year.”
Walker cites Truth in Accounting approvingly as a public resource, one reason I am writing this review today. But I recommend Walker’s book, period, and recommend a book in turn to Walker, if he hasn’t read it already. It’s a book from 1952, by Senator Paul Douglas, titled “Economy in the National Government.” Douglas, an unabashed liberal, delivers a credible and passionate plea for fiscal responsibility in that valuable volume, one we all can learn from today. One of his lines was “a liberal is not a wastrel,” and Douglas dedicated no small portion of the book to identifying waste and inefficiency in the Defense Department.
Douglas, a Democrat, was also a Cold Warrior, and his primary goal was not to reduce military capability per se, but to improve the productivity of defense spending. Douglas’ concluding chapter for that book was “The Budget Must Be Balanced!” In that chapter he outlined how forces later documented by the “public choice” of economics feast on government to feed special interest groups with targeted benefits, at long-run general expense.
Walker’s recommendations include a call for consideration of a new “Fiscal Responsibility Amendment” to the U.S. Constitution. He doesn’t do so with blinders on, cautioning how balanced budget requirements can be gamed, and how pathetic the federal “debt limit” has proved to be in practice. The amendment recommendation arrives in a chapter titled “Budget Process and Controls,” which begins with the observation that “It should be clear the federal government has lost control of the nation’s finances, and neither political party is dedicated to fiscal responsibility.”
Walker warns that the amendment should not be geared to “balanced budget”-type approaches, given how easily they can be gamed, and recommends using a debt-GDP framework for any constitutional constraint. But any future amendment development efforts on this score should include careful consideration how that framework itself can be subject to uncertainty, and manipulation.
Walker has always been a prodigious and diligent worker, and this book shows that off. He started it in May 2020, amidst the arrival of the pandemic, and his thorough volume arrived just four months later. Walker has made fabulous contributions to federal government financial management in his career, particularly in his leadership of the U.S. Government Accountability Office. With this provocative and inspirational book, he continues to make that contribution.
Did states vote their wallets in the vote for President?
November 10, 2020
States, of course, don’t vote – individual people do (including individual Electors, a topic for another day). But looking across the 50 states, for the states called by AP to date for the Presidential election, there is a clear trend. States in the Democratic bucket tend to have state governments in much worse shape, financially, than the Republican states.
The average “Taxpayer Burden” calculated by Truth in Accounting for the Democratic states was $17,300 in the latest fiscal year, about ten times as high as the $1,600 burden calculated for the Republican states.
Looking ahead, fiscal federalism issues are not likely to lose a lot of steam. Federal “stimulus” and “relief” packages under consideration and debate have mixed costs and benefits for citizens and taxpayers in states of varying financial condition. Congressional/Executive branch interplay may get even more interesting in the months ahead – with the central bank part of the picture as well.
Illinois Governor Pritzker makes $2 billion Thanksgiving Eve announcement
November 30, 2020
Last Wednesday, Illinois Governor J.B. Pritzker announced that the State of Illinois intends to borrow another $2 billion from an extraordinary Federal Reserve facility on top of $1.2 billion that it borrowed back in June. Pritzker reportedly stated that the goal of the borrowing is to “continue managing the state’s massive bill backlog.”
Back in June, before the first $1.2 billion loan, Illinois’ bill backlog was about $6 billion. It fell by about $2 billion the first week after that loan was secured, but has since risen to about $7 billion.
The Fed has stated that its new Municipal Liquidity Facility is authorized under Section 13(3) of the Federal Reserve Act, which make loans available to a wide range of entities under “unusual and exigent circumstances.” However, this lending is theoretically not available for “insolvent” entities, and for good reason.
How do you define “insolvent” entities, for this purpose? The law requires a certification from the CEO or other leader of the borrower that it is not insolvent. For the June $1.2 billion loan, Pritzker wrote a letter titled ““Certification Regarding Solvency and Adequate Credit,” certifying that the State of Illinois is “not insolvent,” with the following reason:
For the purposes of this certification, a person or entity is “insolvent” if it is in bankruptcy or any other Federal or State insolvency proceeding (as defined in paragraph B(ii) of Section 13(3) of the Act), or if the person or entity was generally failing to pay undisputed debts as they become due during the 90 days preceding the date of borrowing under the Facility.
In other words, it appears the State of Illinois was paying down its bill backlog in June with the proceeds of a loan denied to entities “failing to pay undisputed debts as they become due.” Will Governor Pritzker sign a similar certification letter if and when the latest loan is finalized?
Resource guide for corporate alternative minimum tax proposals
January 13, 2021
In recent years, proposals have surfaced for basing corporate income taxes not on the accounting that companies provide to the IRS, but on “book income” based on generally accepted accounting principles. For publicly-traded corporations, this means taxes would be based on the financial statements they report to shareholders. President-elect Joseph Biden has called for such a system, which could impose significantly higher taxes on many corporations.
The bibliography below provides a resource for anyone interested in getting up to speed on the history and implications of alternative corporate income taxes. It includes articles from a variety of perspectives dating back to the Tax Reform Act of 1986. It is arranged alphabetically by the author’s last name. Some of the links will not work for anyone without access to Loyola U. Chicago’s library, but at least you will have the reference to use for any library resources you do have available. The bibliography will likely grow over time, and lay the basis for a primer on the related accounting and public policy issues.
Corporate AMT Bibliography
Byrle Abbin, “Corporate Reporting: How Will the New Corporate AMT Affect Financial Statement Income?” Financial Executive, Nov/Dec 1987
Anna Akins, “What Joe Biden’s US Tax Plan Could Mean for Big Tech,” S&P Global Market Intelligence, October 2020
Barnes Wendling, “Insights on President-Elect Biden’s Tax Plan As It Impacts Individuals and Businesses,” November 2020
Charles Boynton, Paul Dobbins, George Plesko and Jeffrey Gramlich, “Earnings Management and the Corporate Alternative Minimum Tax,” Journal of Accounting Research, October 1992
Robert Brown and Philip Wiesner, “The Corporate Alternative Minimum Tax: Some Questions and Answers on the Book Income Adjustment,” The Tax Executive, Fall 1987
Terrence Chorvat and Michael Knoll, “The Case for Repealing the Corporate Alternative Minimum Tax,” SMU Law Review, 2003
Committee for a Responsible Federal Budget, “Senator Rand Paul Releases Flat Tax Plan,” November 2015
Mark Degler, “The Corporate Minimum Tax and the Book Income Adjustment: Problems and a Possible Alternative,” Virginia Tax Review, Spring 1988
Gary Guenther, “Business Investment and the Repeal of the Corporate Alternative Minimum Tax,” Congressional Research Service, March 2002
Jeffrey Gramlich, “Discussion of Earnings Management and the Corporate Alternative Minimum Tax,” Journal of Accounting Research, January 1992
Michelle Hanlon and Jeff Hoopes, “Warren’s Corporate Tax Solution is Fundamentally Flawed,” The Hill, April 2019
Diana Hope, “Biden’s Proposed Minimum Book Tax Plans,” Accounting Web, November 2020
Robert Hunt and William Pollard, “Understanding the Corporate AMT Book Income and ACE Adjustments,” The Practical Accounting, April 1990
John Janiga, “The Corporate Alternative Minimum Tax: A Critique and Exploration of Alternatives,” Loyola U. Chicago Law Journal, 1988
Robert McIntyre and David Wilhelm, “Corporate Taxpayers and Corporate Freeloaders: Four Years of Continuing, Legalized Tax Avoidance by America’s Largest Corporations,” Citizens for Tax Justice, August 1985
Alex Parker, “Biden Minimum Tax Plan Could Collide With Economic Recovery,” Law360 Tax Authority, October 2020
Kyle Pomerleau, “An Analysis of Senator Warren’s ‘Real Corporate Profits Tax,’” Tax Foundation, April 2019
Kyle Pomerleau, “Joe Biden Wants to Reintroduce a Corporate Minimum Tax,” American Enterprise Institute, December 2019
Kyle Pomerleau, “Joe Biden’s Alternative Minimum Book Tax,” Tax Notes Federal, October 2020
Paul Shockett and Kate Matieu, “Biden’s Tax Proposals: Considering the Impact on Corporate Taxpayers,” Skadden, September 2020
Kyle Smith, “Elizabeth Warren’s Corporate Tax Plan Sounds Reasonable. It Isn’t,” Bloomberg, April 2019
Samuel Starr and Kathryn Kindren, “Corporate AMT: The Book Income Adjustment,” The Tax Adviser, September 1987
Omair Taher and Dustin Stamper, “The Future of Tax Law Hinges on the 2020 Election,” Accounting Today, February 2020
U.S. General Accounting Office, “Experience With the Corporate Alternative Minimum Tax,” April 1995
Warren Democrats, “Real Corporate Profits Tax,” Medium, April 2019
Garrett Watson, “Biden’s Minimum Book Income Tax Proposal Would Create Needless Complexity,” Tax Foundation, December 2019
Garrett Watson, Huaquin Li and Taylor LaJoie, “Details and Analysis of President-elect Joe Biden’s Tax Plan,” Tax Foundation, October 2020
Michael Winters, “How to Redirect Populist Anger? Enact Alternative Minimum Corporate Tax,” National Catholic Reporter, January 2021
Robert Wood and Nancy Hanrahan, “The Corporate Alternative Minimum Tax as a State Revenue Source,” National Tax Journal, September 1988
Matthew Yglesias, “Elizabeth Warren’s New Plan to Make Sure Amazon (And Other Big Companies) Pays Corporate Tax, Explained,” April 2019
Interstate migration trends: What’s going on?
January 14, 2021
Every year, in January, United Van Lines (UVL) releases its annual “National Movers Study.” UVL is one of the largest moving companies in the nation. For its study, UVL looks at all of its interstate moves, and calculates the share of outbound shipments for each state. We include that data in our “Data-Z” website, going back every year to 1978 (when UVL started doing its annual study).
In its latest study, for 2020, the five states with the highest outbound shipments percentage were (in order from highest to lowest) New Jersey, New York, Illinois, Connecticut and California. The five states with the lowest percentages were (from lowest to highest) Idaho, South Carolina, Oregon, South Dakota, and Arizona.
What characteristics do outbound states (where people are fleeing) share compared with inbound states?
I calculated the average outbound shipments ranking of the 48 continental United States in the last five years and compared it to a variety of other rankings you can calculate with data we compile in Data-Z, including:
WalletHub’s Tax Burden
Balanced Budget Frequency
TIA’s Taxpayer Burden
Lawyers per 10,000 Residents
ALEC’s Economic Outlook Ranking
TIA’s Zombie Index
Age of State, Based on Year Admitted to Union
Population
Democratic Share of Vote for President Last 5 Elections
Average Winter Temperature
The ordering of the list above is not an accident. From top to bottom, those 10 characteristics are ranked in terms of how closely correlated they are to the outbound shipments average for the last five years as reported by UVL.
Average Winter Temperature has the lowest correlation (the least significant relationship) with outbound moves, among these ten factors. People are moving to warmer states, on average, but other factors have a much closer relationship with moving trends in recent years.
The American Legislative Exchange Council calculates an “Economic Outlook Ranking” for the 50 states. In the last five years, states scoring well on their ranking also have had significant relative inbound migration, according to UVL.
People are moving away from lawyer-intensive states. There is a longer story there.
The last three variables have the strongest relationship with UVL’s migration trends in recent years. Truth in Accounting (TIA) calculates a “Taxpayer Burden” based on our methods for assessing state (and city) government financial position. A high “Taxpayer Burden” reflects consequences facing future taxpayers. And in recent years, states that have accumulated high TIA “Taxpayer Burdens” have had significant outmigration.
WalletHub also calculates a Tax Burden, but it is based on current tax payments as a share of current income in the state. People are moving away from states with high WalletHub “Tax Burdens,” too.
“You can me now, or pay him later,” was the line on an old Fram Oil Filter commercial. Either way, taxpayers are seeking friendlier places.
The factor stuck in between the two taxpayer burden measures in the list above is most interesting – it is based on how frequently state governments have kept accrual expenses below accrual revenue, annually, in the last 15 years. People are moving away from states whose governments don’t truly “walk the talk” on balanced budget requirements.
How about UVL’s latest results? What do the states with the highest outmigration in 2020 have in common compared to the states with the best migration results?
The “Average Winter Temperature” rankings are almost the same, on average, for the two groups of five states. The biggest differences between the average rankings for those two groups of five states each are for ALEC’s Economic Outlook Ranking, TIA’s Taxpayer Burden, Truth in Accounting’s Zombie Index, Lawyers per 10,000 Residents, WalletHub’s Tax Burden, and Democratic Share of Vote For President.
We will be updating our Data-Z website to include all of UVL’s latest results soon.
Comparing Illinois to its neighbors on outbound migration
January 21, 2021
United Van Lines (UVL) issues an annual moving study based on their interstate shipments for household moves. This study provides a timely read on migration trends. We include their results in our “Data-Z” website, where you can easily create charts comparing states on hundreds of economic, demographic, and government financial data series.
Here’s a step-by-step guide to create charts on Data-Z, using the recently released UVL results for 2020 and comparing Illinois’s outbound shipments percentage for UVL to UVL’s results for Indiana, Michigan, Wisconsin, and Iowa.
1. Go to our Data-Z website.
2. Hover over “Charts” in the top tab.
3. Slide the pointer down to “Create Your Own State Chart,” and click on that.
4. In “Step 1,” select Illinois, Indiana, Michigan, Wisconsin and Iowa.
5. In “Step 2,” scroll down to the “Demographic” section, and within the “Population” section, select “Outbound Shipments Percentage (United Van Lines)”
6. Scroll all the way down to “Step 3 – Select Available Years.” Click on each year from 2005 to 2020 – this will give you a look at what happened in the 2007-2009 economic financial crisis, and what has happened since then – especially lately.
7. Click on “Generate Chart,” and then change the Chart Type to a line chart.
You should end up with the chart below. That line at the top in the last decade is Illinois:
It’s not a pretty picture, at least for Illinoisans. The state with a state government (and its largest city government) in the worst financial condition (by far) among its neighboring states has been repelling more and more of its residents, and attracting fewer and fewer residents, leaving a greater financial burden for the citizens and taxpayers who remain.
You can also share charts you make on Data-Z with friends and family, either by clicking on the download button at the top right of the chart at Data-Z, or by clicking on “Share Your Chart” at the bottom, which generates a unique URL, like this one for the chart above.
Student loans – good government assets?
January 25, 2021
Student loans have been the largest and fastest growing asset on the federal government’s balance sheet over the past decade. The federal government reported more than $1 trillion in federal direct student loans in 2019. Calls for the government to forgive these loans have grown increasingly vocal in recent years, particularly in recent months.
Late last year, then-Senate Minority Leader Sen. Charles Schumer (NY) called on President-elect Joe Biden to forgive up to $50,000 in student debt per borrower on his first day in office. Several days ago, President Biden directed the Department of Education to extend a freeze on federal student loan payments through at least October 2021, and student loan forgiveness remains a focus of interest among many in Congress.
The treatment of student loans as assets on the federal government’s balance sheet is curious for a few reasons. Back in 2014, I wrote an article for Truth in Accounting titled “A good investment? Or just buying their silence?” The article raised questions about federal government expectations for the long-run profitability of its lending programs, expectations which have since fallen sharply. And recent developments suggest significant write-downs in many billions of dollars are now possible.
Consider, however, what this means for the logic of treating student loans as assets, while not reporting the massive unfunded obligations for Social Security and Medicare as liabilities on the federal government’s balance sheet.
The Social Security “Trust Fund” doesn’t have cash, or gold bars. It holds unique, non-marketable securities issued by the U.S. Treasury. And the annual “Analytical Perspectives” section of the President’s budget regularly tells Americans that the securities issued to the Social Security trust fund represent obligations of one government account to another, not obligations to Social Security participants as individuals.
This is consistent with the federal government’s accounting treatment of the massive unfunded present value obligations in Social Security (and Medicare). Those obligations are not reported as debts on the federal government’s balance sheet. How does the government justify this? The reasoning is that the government controls the law (and the benefits), and can change the law at any time.
But the government controls the law governing how government provides loans to students, and it can change that law at any time, too.
That doesn’t appear to stop the government from reporting more than $1 trillion in student loan assets. Maybe it should start reporting tens of trillions of dollars in unfunded Social Security and Medicare obligations, too.
Illinois' budget baloney
February 18, 2021
There are words, and there are deeds, the old saying goes.
Illinois Governor J.B Pritzker's budget address yesterday belongs in the “words” category.
Budgets are important, don’t get me wrong. They are the mechanism used under the Illinois Constitution to authorize and allocate billions of dollars of taxpayer dollars, every year, for the objects of affection chosen by the Illinois Legislature and Governor.
But it is important to recognize what budgets are -- and what they are not.
Budgets are prospective, forward-looking planning and authorization documents. They are not results.
Budgets get a lot of attention, perhaps too much attention. Yet when our state, local and federal governments issue their annual financial reports, they arrive to a deafening silence -- especially when compared to budgets.
Why? I’m afraid an important reason is that a lot of people, including well-organized special interest groups feasting on the public purse, care a lot more about spending than they do about accounting for that spending.
There are words, and there are deeds. And historically, Illinois citizens and taxpayers have been misled by years and years of claims to “balanced budgets,” even as Illinois accumulated massive many-billions-of-dollars-worth of unfunded debt obligations.
The wiggle room that has been crafted by the politicians and special interests that benefitted from unsustainable kick-the-can-down-the-road financing comes from how the Illinois government accounts for debt and expenses.
Accounting standards effectively allow governments to do things like count borrowing proceeds as revenue, and to deliberately underfund retirement benefits, as means for “balancing budgets.”
At Truth in Accounting, we are on a related mission to encourage the Governmental Accounting Standards Board to stop misleading and confusing accounting standards for financial statements related to budgets. You can learn more about that at our website.
You can listen to Gov. Pritzker’s full budget address here. Further analysis to follow.
But remember, there are words, and there are deeds. We are going to learn more about the deeds when Illinois issues its audited annual financial report for fiscal year 2020 in a few months, and I encourage taxpayers and citizens to pay more attention then, too.
COVID dollars: Stimulus, relief or bailout? A closer look at some math
March 8, 2021
In a recent Chicago Tribune op-ed (“Don’t call it a ‘bailout.’ The states urgently need federal relief”), state comptrollers Susana Mendoza (Illinois) and Kevin Lembo (Connecticut) called for large-scale new federal government spending directed at state and local governments, citing demand for government services amidst economic hardship.
In making their case, they stated:
"While both Illinois and Connecticut have been addressing long-standing fiscal challenges and legacy costs within our respective state budgets in recent years, both also act as donor states, contributing more in the form of federal taxes than we receive back in federal aid."
This reasoning is consistent with other widely-reported efforts to deflate claims that federal “stimulus” dollars unfairly penalize fiscally responsible states. The “bailout” claims are unfair, the argument goes, because fiscally challenged governments tend to be in states that send more money to Washington, D.C. than they get in return.
But let’s take a closer look at this reasoning.
In the first clause of the sentence quoted above, Mendoza and Lembo are referring to Illinois and Connecticut, and specifically, the state governments of Illinois and Connecticut. But then they say that Illinois and Connecticut act as donor states, contributing more in federal taxes than “we” receive from the federal government.
Who is this “we?”
Illinois and Connecticut state governments don’t pay taxes to the federal government. In Illinois’ latest financial report, a report prepared by the department led by Mendoza (note that the latest report available is for fiscal 2019, for a fiscal year that ended more than 600 days ago), Illinois reported roughly $25 billion in grant “revenue,” most of it from the federal government. This doesn’t add up to Illinois contributing more in federal taxes than it receives from the federal government.
So how does their math work?
To claim that Illinois and Connecticut act as donor states, Mendoza and Lembo are “counting” on the money sent by their state’s taxpayers to the federal government, a very large amount.
But when they call for federal “relief,” they aren’t calling for federal money for state taxpayers. They are calling for federal “relief” to be sent to state governments.
They are adding and subtracting apples and oranges, deceptively.
As an Illinois taxpayer, I don’t need federal “relief” for the Illinois state government. I would have to pay for that, along with taxpayers in responsible jurisdictions in other states.
Meanwhile, it looks like the light at the end of the tunnel is going to arrive this week.
Was the pandemic to blame for Illinois state revenue weakness before the latest federal stimulus bill?
March 15, 2021
The massive $1.9 trillion federal ‘stimulus’ packaged signed into law last week included $350 billion for state and local governments. At the onset of the pandemic, many feared already-challenged jurisdictions were going to take a huge revenue hit.
A few weeks ago, however, an office of Illinois government released a little-noticed but remarkable report including the most recent data on revenue trends in Illinois government. The report featured a lead article about the impact of the pandemic on gaming revenue, discussing a ‘severe’ pandemic-induced decline.
But the most remarkable statistics in the report were those contained in the fiscal year-to-date totals for tax revenue. In the eight months ended February 2021, total state tax revenue rose 10% over the same year-earlier period, despite the fact that the year-earlier period ended a month before the arrival of the pandemic. The increase in tax revenue was led by personal income taxes as well as corporate income taxes.
Timing changes for payments were argued to be partially responsible for the year-over-year increase. But looking over the past four years, personal income tax revenue in Illinois in that eight-month period rose from $12.5 billion in 2018 to $13.1 billion in 2019, to $13.8 billion in 2020, and then to $15.6 billion in 2021. Corporate income tax revenue almost doubled over that same period. Sales tax revenue grew at a more moderate pace, but it was still growing amidst Illinois’ population decline.
Illinois’ state government dug itself into a huge financial hole over decades. Any argument Illinois needed massive new federal ‘stimulus’ or ‘relief’ spending in the bill passed last week can’t rely on claims of pandemic-induced revenue weakness alone, however.
Illinois' tax revenue was going up, not down, during the pandemic.
Uncle Sam reports dismal financial results, to deafening silence
March 29, 2021
Late last week, the federal government of the United States issued its annual financial report. The report arrived, as it usually does, to deafening silence. Meanwhile, the American Rescue Plan of 2021 and related legislation under consideration have only amplified the disturbing trends evident in the results for fiscal year 2020.
From 2015 to 2019, the reported budget deficit of the federal government more than doubled, reaching nearly $1 trillion. A better measure – net operating cost, an accrual rather than cash-based deficit reading – nearly tripled over the same time frame.
But 2020 brought a blowout. The reported budget deficit tripled from $984 billion in 2019 to $3.1 trillion in 2020, while net operating cost mushroomed as well.
Over on the balance sheet, the federal government’s reported net position – assets less reported liabilities – fell by about $3.8 trillion to a (negative) $26.8 trillion, after deteriorating by “only” $1.5 trillion in 2019.
The federal government has been warning for years that its fiscal path is unsustainable in this report and it repeated those warnings again. The fiscal gap – an estimated amount of spending reductions and/or tax increases required to keep the debt/GDP ratio from rising unsustainably in the future – mushroomed as well, as the government did the opposite of what was required to keep things sustainable.
We will be releasing our updated Financial State of the Union report soon, which is based on the annual financial report. It isn’t likely to be a pretty picture.
As in previous years, however, the federal government offered the following comforting sentences while introducing a balance sheet in which (understated) reported liabilities swamp reported assets by more than $25 trillion.
There are, however, other significant resources available to the government beyond the assets presented in these Balance Sheets. Those resources include stewardship PP&E in addition to the government’s sovereign powers to tax, and to set monetary policy.
Our federal government certainly has the power to tax, under our Constitution. But here we are, in a document theoretically securing the accountability of the government to the people, and the government is telling We the People – the sovereign, under our Constitution -- that We don’t have to worry about it because it possesses the sovereign power to tax us and to inflate the value of our money away.
Clock is ticking, Illinois – and time is money
April 14, 2021
Today is April 14, 2021, the day before “tax day” – and the State of Illinois has yet to issue an audited financial report for the fiscal year ended June 30, 2020.
Last year, amidst another long delay, the State of Illinois issued a report in January 2020 noting that state law required the state to deliver the report for fiscal 2019 by December 30, 2019, but that the auditor could not complete the audit, and the state was exercising its statutory authority to issue an “interim” report. The final report for fiscal 2019 arrived on April 23, 2020.
We are closing in on April 23, 2021, and we still don’t have an “interim” report for the year ended June 30, 2020. For anyone trying to track State of Illinois finances, the most recent audited financial report is for a year that ended more than 650 days ago.
Last year, Illinois powers-that-be were blaming the previous administration from the other party. It’s going to be harder to do that this year.
Janet Yellen’s priorities as Secretary of the Treasury of the United States
April 23, 2021
In late March, the U.S. Department of the Treasury released the annual Financial Report of the U.S. Government. This important report came out, as it usually does, to a deafening silence. Mainstream media coverage was basically zilch, including the major daily newspapers.
When budgets come out, the media typically is all over them, both for the federal government and state and local governments. But not the audited financial reports -- the results -- of government fiscal behavior and misbehavior.
Two depressing but motivating reasons why likely include the fact that special interest groups care a lot more about government spending money than they do about accounting for the results, and that a lot of people tend to focus on the here and now -- the current year -- rather than consider the long-term consequences of current decisions.
But a third reason for the lack of attention to the annual financial report of the U.S. government deserves more than a mention. The Treasury Department itself is partly to blame.
Here’s a link to the Treasury Department’s webpage listing its news releases. In the days before and after the release of the report, there is not a single press release announcing the release of the annual financial report, signed by Treasury Secretary Janet Yellen and dated March 25, 2021.
That press release webpage shows lots of other releases, including how Treasury officials met with African leaders about the “COVID-Climate emergency,” sanctions on military holding companies in Burma, statements by Janet Yellen on the International Trans Day of Visibility, and a statement on bridge financing in the Sudan. But nothing about an important report that should help secure the financial accountability of the U.S. Government to the people.
Maybe because that report had so much bad news in it. See Chuck Chokel’s analysis in our recent “Ask the Experts” webinar.
Did ‘Get-Out-The-Vote’ campaigns bias Census – and apportionment – results?
April 29, 2021
Back in April, the U.S. Census bureau announced the results of the 2020 Census. Those results, which come every 10 years, were immediately delivered to Congress to determine the number of seats to be apportioned to states in the House of Representatives. Some states gained and some states lost, based on the change in population since 2010, the last decennial census.
The U.S. Census Bureau also calculates and publishes state population estimates on an annual basis. In Illinois, those estimates were showing a loss of more than 250,000 people in Illinois over the last decade, while the “actual” results arriving in the full decennial Census only showed a loss of 18,124.
Commenting on the results, Illinois Governor J.B. Pritzker chose to focus on how much lower the decline was than earlier estimated. In a story at Fox News Chicago, Mike Flannery reported that …
Democratic Gov. JB Pritzker mocked critics for using previous Census bureau ‘estimates’ that mistakenly foresaw Illinois losing a quarter-million or more residents. Pritzker pointed to ‘carnival barkers, people who've run down this state for years, who have said … we've lost hundreds of thousands of people over the last ten years. As it turns out, it's about 7,500 people.’
18,124 is bigger than 7,500, but it’s a lot lower than 250,000. Was this just a statistical thing, a survey/sampling issue?
Looking across the 20 largest states, and the difference between the “actual” results in the decennial Census to the estimated annual Census totals, there are some extraordinary tendencies. States with the biggest positive surprises in population change (“actual” minus estimated changes) have a STRONG tendency to be a) states with a higher share of Democratic voters, b) states with a higher share of public sector workers are covered by collective bargaining agreements, and c) states with higher Taxpayer Burdens as calculated by Truth in Accounting.
Among the 20 largest states, the five states with the largest positive surprises (“actual” higher than estimated population change) were New Jersey, New York, Massachusetts, Maryland, and Illinois.
On average, those five states had a much higher share of Democratic votes for President in recent elections than the other 15 of the largest states. The share of their public sector workforce covered by collective bargaining agreements runs about 56 percent, compared to an average of 33 percent for the other 15 states. And the average TIA Taxpayer Burden measure of state government financial condition runs about $35,000 for those five states, compared to an average of about $6,000 for the other 15 largest states.
Congressional apportionment is about many things, including money.
Is it possible the systematic tendencies noted above reflect factors beyond random statistical reasons why the Census results differed from what might have been expected?
There certainly were strong efforts to “get out the vote” in lots of places as the Census got underway. It is also possible that those efforts were stronger in some places than others.
Consider, for just one example, this message delivered by the University of Illinois in March 2020. Titled “Millions at stake in census; be counted,” it began “An accurate census count is important to Illinois. The state could lose two congressional seats based on the population totals informed by the next census. Federal funding for programs including Medicaid, Supplemental Nutrition Assistance Program (SNAP), highway planning and construction, section 8 housing vouchers, the national school lunch program, and special education grants are all based on our census counts.”
Some states may have been trying harder to be accurate than others.
When new stuff becomes 'infrastructure,' do accounting foundations tremble and shake?
May 14, 2021
In late March, President Joe Biden’s White House issued a press release titled “FACT SHEEET: The American Jobs Plan.” It stated that, on top of already-passed “American Rescue Plan,” the American Jobs Plan would be “an investment in America that will create millions of good jobs, rebuild our country’s infrastructure, and position the United States to out-compete China.”
The release identified six main goals for the Plan, including one to “solidify the infrastructure of our care economy by creating jobs and raising wages and benefits for essential home care workers.”
This goal and related initiatives have drawn attention, and some criticism, for stretching the traditional meaning of infrastructure.
This could be more than just a sales pitch.
Accounting is about numbers, but it is also about words. What is a “capital asset,” for example? Might calling new things “infrastructure” have implications for accounting for dollar outflows? For state and local governments, could it matter for expenses or expenditures if spending on infrastructure that includes home care is capitalized?
In 2019, the Governmental Accounting Standards Board (GASB) added a project called “Capital Assets” to its research agenda. It identified how different jurisdictions followed different practices, for example, in choosing whether or not to capitalize and depreciate infrastructure spending.
This GASB project is still in the early stages, but GASB has development work planned for later this year. This project bears watching, together with future developments in how our federal, state and local governments spend on “infrastructure” in the “American Rescue Plan.”
You can see a more complete (one-hour) discussion of the Biden Administration’s infrastructure plan that we recently had with energetic, entertaining and informative Steven Malanga here.
1
Tracking numbers – and words – in ‘unsustainable’ government reports
May 25, 2021
We have updated our “Data-Z” website with data from the annual Financial Report of the U.S. Government. You can create charts at our website using a wide variety of financial, economic, and demographic indicators for cities, states and the federal government.
You can do that by:
Going to www.data-z.org.
Hovering over the “CHARTS” option at the top of the front page.
Choosing Federal, State, or City chart options, and then selecting available variables and the years you are interested in.
For example, let’s create three charts using the data we just updated.
First, let’s see how long it takes to get the federal government’s annual report every year. It keeps taking longer and longer.
Second, let’s see what’s happened to the net financial position of the federal government over time, as reflected in our “Taxpayer Burden” measure of government finances. It keeps getting worse and worse.
Third, let’s look at an interesting variable we track while analyzing the rhetoric in the report. This is simply the number of times the word “unsustainable” appears in the report. The trend for that indicator has been going up and up.
The number of “unsustainable” references did go down (by one) last year, even as the federal government’s fiscal deterioration accelerated in fiscal (September) 2020. And the report was written amidst massive spending initiatives undertaken after the end of the last fiscal year.
Not to leap to conclusions, but this could be one of those ‘dogs that didn’t bark’ stories. It may be less fashionable to call the federal government’s finances unsustainable these days, at least in some quarters.
Biden’s first budget – A hot air balloon waiting to pop?
May 27, 2021
U.S. President Joe Biden will introduce his first budget for the federal government tomorrow. The mainstream media is already filled with hundreds of articles about it – even before it has been issued.
Contrast the attention to the budget to the coverage of the annual Financial Report of the U.S. Government. That report was released about two months ago -- to deafening silence. Mainstream media coverage was basically zilch.
Not to end the week on a depressing note, but this doesn’t bode well for the future of our Republic.
Back in March, the federal government released a report showing marked and accelerating deterioration in our federal government’s financial position. And nobody cared. But the budget gets a lot of attention.
Why? A simple reason could be that many more people care about the government spending money than the number of people that care about the government accounting for that money.
There are words, and there are deeds, the old saying goes.
A month ago – about a month after the actual financial results for the federal government for fiscal 2020 were released – President Biden delivered another first – his first “State of the Union” address.
There were more than 6,000 words in that speech. How many times did the word “debt” appear, in a speech on the heels of a huge increase in federal government debt?
Not once. Zilch.
How about the word “deficit?” Only once, in the following:
So how do we pay for my Jobs and Family Plans? I’ve made clear that we can do it without increasing deficits.
At least he didn’t say he made it “perfectly clear.”
Biden isn’t alone, of course. Presidents from both sides of the aisle have given short shrift to reporting on the fiscal state of the federal government in their “State of the Union” addresses. And the media has long stressed reporting on budgets before results, whoever has control of Congress or the White House.
About time to close up shop for the holiday weekend. But that budget deserves some scrutiny, and in light of the overlooked (and dismal) results in the Financial Report of the U.S. Government.
‘Full funding’ for pensions – two ways to skin a cat
June 8, 2021
Calling a half-empty glass full doesn't fill it up.
In a June 2 cover-story on the Illinois state budget (“$42 billion ‘fiscal discipline’ budget OKd”), the Chicago Tribune reported that the spending will “meet the state’s obligations to fund schools and make its required annual contribution to its severely underfunded pension plans.”
Not to make a mountain out of a molehill, but this type of reporting reinforces a long, slow-moving train wreck of misleading statements by public officials.
Spending plans that “fully fund” pension obligations by making statutorily required contributions -- amounts required by legislators, by law -- do not necessarily fully fund pensions. In fact, Illinois has a sad history of passing laws with funding that falls far short of actuarial requirements -- the amounts necessary to keep pension (and related retirement health care) debt from rising over time.
For an example, take a peek at the Illinois Teachers’ Retirement System (TRS). Their annual report for 2020 is available here. The table on pdf page 2 shows that the system has accumulated more than $50 billion in invested assets, but this massive amount actually falls far short of the nearly $140 billion in present value obligation for future pension payments, leading to a nearly $90 billion unfunded liability.
A table on page 54 of the report (pdf p. 57) helps to illustrate how this was “accomplished.” Statutory contributions – the amounts required by laws passed by Illinois legislators and signed by the state governor – fell short of the actuarially determined amounts every year in the ten years ended 2020, and the annual shortfall “rose” from about $420 million in 2011 to $3.1 billion in 2020 – a $3 billion shortfall for just a single year.
The practice of distributing unfunded promises to pay money in the future has been a key of the tool chest that politicians have employed in misleading the citizenry that Illinois has lived up to constitutional balanced budget requirements, when in truth it has done anything but.
Interstate income migration suffering for 'high tax' states
June 15, 2021
A few weeks ago, the IRS released an annual report useful for tracking interstate migration trends. The latest data echoed patterns we've seen in recent years. States with higher tax rates and worse state government financial condition continued to experience higher migration of taxable income.
More specifically, states where taxpayers pay relatively high taxes compared to personal income have been undergoing relatively high outmigration of taxable income -- the Adjusted Gross Income (AGI) reported on their annual tax returns. And taxpayers in states with state governments in worse financial condition, as measured by TIA’s “Taxpayer Burden,” have also had higher outmigration. The taxpayers in these states apparently can see some writing on the wall.
That’s the message from the latest IRS data. Unfortunately, the latest IRS data is only for 2019 – roughly two years ago and a year before the pandemic and lockdowns even started.
But a closer look at more recent data suggests the disturbing trend facing states like New Jersey, Illinois, and Connecticut – states with high taxes and/or poor government finances – have not enjoyed any real cause for celebration since the economic recovery started early this year.
You can view states and their results on AGI Migration with the charting facility at our Data-Z website.
Here’s a look at New Jersey, Illinois, and Connecticut on TIA’s “Taxpayer Burden” measure of state government financial condition in the latest years for which we have audited financial reports, comparing them to the 50 state average. New Jersey, Illinois and Connecticut ranked as the lowest three states in the nation on this measure.
These three states also rank high on how heavy taxes are, relative to income, for taxpayers in those states. Here’s a similar chart comparing New Jersey, Illinois and Connecticut to the 50 state average based on WalletHub’s measure of tax burden, which relies on tax payments (not debt) for its measure of burden. (The years for WalletHub’s study relate to the year they published the data, not the year for income or taxes).
You can pay me now, or you can pay me later, the old commercial saying goes. Well, taxpayers in New Jersey, Illinois, and Connecticut were looking for the exits, at least through the latest year available for IRS migration data.
But what’s been happening lately, on the income migration front? After 2019 ended?
We don’t have IRS data for 2020, yet. But we do have migration estimates from United Van Lines, a large interstate moving company. The adverse migration trends for these three states remained in place, according to this source. If anything, the deterioration accelerated.
We can also look to monthly state-level estimates for employment produced by the Bureau of Labor Statistics for clues about recent trends relating to migration. Granted, job gains aren’t necessarily migration results, especially from recent estimates subject to annual revisions. But here too, the news isn’t good, at least for the likes of New Jersey, Illinois and Connecticut.
Employment has rebounded in recent months in those three states, as it has around the nation. But those three states took a significantly bigger hit in the early months of the crisis, in terms of total employment, and their recovery has actually lagged the national average since early 2020.
The Fed - an ironic authority expressing concern about rapid debt growth
June 15, 2021
Sam Goldfarb wrote an article in the Wall Street Journal yesterday titled “Pandemic Hangover: $11 Trillion in Corporate Debt,” The article noted how non-financial corporate debt had risen to, “according to the Federal Reserve, about half the size of the U.S. economy.”
Goldfarb also noted that, in a May report, the Fed expressed concern that investors had “rarely” been compensated for the risk of that debt and that the Fed report concluded “vulnerabilities arising from business debt remain elevated.”
People who live in glass houses shouldn’t throw stones.
In its latest weekly consolidated balance sheet for the 12 Reserve Banks, the Fed reported $7.9 trillion in total liabilities. That’s $7.9 trillion for just one “company,” compared to the $11.2 trillion for thousands of non-financial companies discussed in that article. And the Fed’s balance sheet has mushroomed since the onset of the 2008-2009 financial meltdown, especially since the onset of the pandemic/lockdown crisis.
The Fed’s total liabilities have nearly doubled since February 2020. Before the 2008-2009 financial crisis (a crisis in which the Fed was far from blameless), the Fed’s liabilities totaled “only” about $870 billion. The Fed’s debt is now about 10 times where it was back in 2007.
Maybe the Fed should be analyzing some of the “vulnerabilities” this poses, either to itself or to the Treasury and, in turn, to U.S. taxpayers and citizens.
Pre-pandemic interstate migration: Will federal bailouts matter?
June 18, 2021
A recent report from the IRS on interstate income migration trends showed continued and significant deterioration for states with high tax rates, poor government financial performance, and low trust in state government. This “latest” data is only for 2019 but helps to underscore the growing pressures in financially stressed jurisdictions before the impact of the pandemic (and government lockdowns) in 2020.
What distinguishes states with high-income inmigration from those losing taxable income to other states? Not surprisingly, state government financial matters that taxpayers care about appear to play a key role.
In 2019, the five states with the highest AGI inmigration on a per-taxpayer basis were (in order from least to most) South Carolina, Arizona, Nevada, Idaho and Florida. The five states with the highest AGI outmigration on a per-taxpayer basis were (in order) Maryland, New Jersey, Connecticut, New York, and Illinois.
The five inmigration states ranked, on average, 18th among the 48 continental states on Truth in Accounting’s “Taxpayer Burden” measure of state government financial condition. They ranked 14th, on average, on WalletHub’s “Tax Burden” measure of income paid towards state and local taxes. They ranked 12th, on average, in the frequency of “truly balanced” budgets – keeping expenses below revenue, based on accrual, not cash-based, accounting principles.
Conversely, the five outmigration states ranked, on average, 43rd among the 48 continental states in Truth in Accounting’s latest “Taxpayer Burden” measure. They also ranked 43rd, on average, on WalletHub’s latest “Tax Burden”. They ranked 44th, on average, on the frequency of “truly balanced budgets.”
Back in 2015, Gallup did a poll on trust in state government. (Gallup hasn’t polled people on this measure since then.) How did the states that performed best (and worst) in inspiring citizen trust measure up on the latest IRS AGI migration rankings?
In 2015, the five states with the lowest rankings on trust in state government were (in order) Louisiana, New Jersey, Connecticut, Rhode Island, and (dead last) Illinois. The five states performing worst on trust in state government in 2015 ranked, on average, 40th in AGI migration in 2019. And the states that ranked worst on trust may have earned their polling performance, looking at their government’s financial condition and record on truly living up to advertised “balanced budget” requirements.
Back in 1970, Albert O. Hirschman penned a valuable book titled “Exit, Voice & Loyalty.” The book developed a model for considering how members of organizations/states can respond to perceived shortcomings in performance. Simplifying, they can speak up, or ship out, and loyalty matters for that choice.
The recent IRS migration data may help illustrate the nature of the demand for federal government “stimulus” that arrived in recent months, which provided significant assistance for especially-stressed states that were facing a loss of resources internally.
The “American Rescue Plan” and related federal government “stimulus” spending may have served as means for socializing losses from state and local government financial mismanagement. I hope those responses don’t ultimately undermine loyalty to the federal government of the United States.
For that matter, Gallup polls on trust in the federal government aren’t exactly encouraging, either.
Illinois housing recovery still lagging national average
June 21, 2021
We recently updated our Data-Z website with new economic and demographic information, including an annual report from the U.S. Census Bureau on building permits for 2020. This resource has been indicating that states with governments in relatively poor financial condition have had a slower long-term recovery from the 2008-2009 housing and financial crisis. While things perked up a little last year, it was generally more of the same in 2020.
For the 10 states in the nation with governments with the worst state government financial conditions, as measured by TIA’s Taxpayer Burden, building permits for new single-family homes rose about 10 percent, on average, in 2020 from 2019, a little slower than the 13 percent increase for the 10 states with governments in the best financial condition. But building permits for those 10 states in bad shape (New Jersey, Illinois, Connecticut, Hawaii, Massachusetts, Delaware, Kentucky, California, Vermont, and New York) were still less than half of what they were in 2005, on average.
Granted, housing prices have been moving smartly higher. But people still aren't building a lot of houses in Illinois.
Here’s a look at Illinois, for example, compared to the 50 state average, using the chart facility we have on Data-Z.
How is 2021 shaping up? Monthly building permits data can bounce around a fair amount, in light of weather and other factors. But here's what the year-to-date totals show (through April) for Illinois and Indiana, compared to the national results. Back in 2006, before the housing crash, Illinois accounted for 2.7 percent of the national Jan-April total, compared to 1.7 percent for Indiana. In 2020 and 2021, Illinois accounted for 0.9 percent of the national total, about one-third of where it was back in 2006. Indiana has been taking a significantly higher share of national permits than Illinois, in both 2020 and 2021.
Prediction vs. management: Uncle Sam and Mother Nature
June 22, 2021
A consumer financial services company recently released a report with projections of individual lifetime tax payments across the 50 states. The study relied on national spending averages coupled with current state-specific taxes, and projected future taxes across the 50 states based on estimates of lifetime expectancy. The study ranked the states on estimates of the share of lifetime earnings to be paid in taxes, including federal as well as state and local taxes.
This study’s methodology may deserve a closer look, but here’s one question it sparked: How should future taxation trends be treated, if not projected, in a study like this? Should tax structures and rates simply be assumed to stay the same, and where they are today? Or should projections like this try to anticipate whether some states may be more likely than others to change their tax policies in the future?
We all have to try to look forward while planning our financial futures, including how our governments matter for that future. But in this regard, I’m reminded of some of the challenges that arise in sailboat racing. Sailors try to manage and anticipate changing wind speeds and directions, in an arena where the wind is invisible, and hard to predict. And flawed predictions can have consequences.
State government financial conditions depend, today, on how any given state may have been kicking the can down the road or not in the past. Some states have been more prone to spending beyond their current means, in light of the expenses they have incurred and the future promises (like pensions) they have distributed.
Many states (and cities) have effectively “undertaxed” their taxpayers. State government representatives greased the wheels for distributing (and redistributing) wealth in the short-run and accumulated debt with consequences for future taxpayers. This concern matters, no matter how one feels about the appropriate size and scope of government. The results have implications for tax policies going forward and can vary across the 50 states.
That’s why it makes sense to compare state and local governments with a blended set of indicators. WalletHub’s “Tax Burden” measure relies on current tax payments and their share of current personal income, for example, while Truth in Accounting’s “Taxpayer Burden” measure helps to capture the depth of current financial stress bearing consequences for taxpayers down the road.
Another factor has arisen to make life more exciting for anyone in the financial projections business, especially projections relating to state and local government tax policies. That is the federal government’s response to the pandemic/lockdown/economic crisis of 2020.
For state and local governments, Uncle Sam is always in the background. Sometimes he is especially willing to distribute (and redistribute) wealth nationally, with varying consequences for different places, including those that have been responsibly managed and those that haven’t.
On this score, consider how dramatically states can differ with respect to OPEB, primarily the liabilities arising from state and local governments have promised for retiree medical care benefits. Could a future "Medicare for All" benefit some states at the expense of others?
Today, bailouts may have encouraged less-than-financially responsible states and cities to delay their internal day of reckoning. But no matter which state we live in, we share a common stake in the pot managed by Uncle Sam.
On that score, we aren’t really in the world of sailboat racing, at least in one respect. Government may be difficult to predict, like Mother Nature. But as citizens and taxpayers, we can (and should) do our best to manage how our representatives set the table for the policy environment. We don’t have to keep seeding financial storms as we have in the past.
Too much money chasing too few goods and services, Part II
July 15, 2021
As we’ve noted previously, the Federal Reserve’s “M2” monetary aggregate began growing significantly faster than the “GDP” measure of economic output in the United States beginning around 2008, amidst the 2007-2009 financial and economic crisis.
With the federal government’s massive fiscal and economic “stimulus” policies arriving together with a pandemic and government lockdowns, M2 growth has recently risen dramatically higher than GDP growth.
Earlier this week, the Bureau of Labor Statistics (within the U.S. Department of Labor) reported that the Consumer Price Index (CPI) rose in June at one of its fastest growing rates in more than a decade. Some people have been pointing to the fact that year-over-year changes in the CPI may be high recently in part because the comparisons to last year’s levels were amidst the onset of the pandemic. But in the second quarter of 2021, compared to the first quarter of 2021 and on a seasonally adjusted basis, the CPI rose at an annualized rate of more than 8 percent, which is the highest quarterly growth rate since the third quarter of 1981.
It’s always worthwhile to keep an eye on alternative inflation measures, given the estimation issues associated with government statistics, and considering the source of those statistics. Along those lines, a recent survey of small businesses by the National Federation of Independent Business (NFIB) returned a result for prices that hasn’t been reached since 1981. And the prices component of the monthly Institute for Supply Management survey of business purchasing managers rose in June 2021 to its highest reading since July 1979.
Inflation can be considered as a tax, and an especially regressive one, falling harder on those with lower income and/or assets. Inflation can be considered one cost of government. But it’s interesting to consider (and we will, in coming months) how well the government a) measures inflation overall, and b) covers the cost of government as an element of the overall cost of living. Government sales taxes end up getting covered by the CPI, for example, as that statistic (uncertain and/or flawed in other respects) measures prices including sales taxes at the retail level. But significant issues arise for other taxes (like property taxes) that matter for the cost of government, as well as taxes that are not explicitly covered by the CPI (or related measures like the PCE deflator).
Back in the Great Depression, economists and government developed our modern framework for Gross Domestic Product (GDP, the total value of goods and services produced in a given period). There were four main components (C+I+G+NX) – Consumer Spending, Investment Spending, Government Spending, and Net Exports. Some have questioned whether the G (Government Spending) belongs there at all, from an opportunity cost perspective, as government spending relies on taxes or borrowing money that could have been spent by somebody else.
But let’s put that interesting debate aside and consider whether what is good for the goose is good for the gander. If GDP should include government spending, should our government do a better job of including the cost of government in its measures of the cost of living?
Will GASB remain on its wayward path?
July 15, 2021
Truth in Accounting has been opposing two exposure drafts from the Governmental Accounting Standards Board (GASB) that could lead to the adoption of a fundamental concept statement and accounting standard. (See, for example, TIA founder and CEO Sheila Weinberg’s comment letter here.)
TIA isn’t alone. The GASB received hundreds of comment letters from elected officials, policy experts, and everyday citizens, most of them opposing these proposals.
Consider a letter from Martin Ives, former board member and vice-chair of GASB, that included:
“In my opinion, stating that the Board’s proposal regarding fund reporting results in the ‘accrual basis of accounting’ is grossly misleading and must be dropped. … In my opinion, the Board has attempted to rationalize a model that cannot be rationalized.”
In early July, GASB held a board meeting and discussed the proposals and feedback. Staff and board members indicated that they intend to nonetheless proceed with what they currently call a “short-term financial resources measurement focus and accrual basis of accounting” for governmental funds statements. These statements are widely used for budgeting by state and local governments and have long provided an unsound if not deceptive foundation for budgeting and related governmental communication. GASB’s proposals would effectively sanction these longstanding practices, and even attempt to provide what GASB would call a “conceptual foundation” for them.
As I reflect on GASB’s proposals, the feedback provided to GASB on them, and the GASB board members’ reflections in an early-July GASB board meeting, I still find myself shaking my head and wondering how, and why, GASB proposed them at all.
Consider, for example, the comment letter by Nick Murray of the Maine Policy Institute, which included:
“… Your proposals will allow state legislators and local government officials to validate budgets that include loan proceeds as revenue and exclude costs that weren’t paid in the respective year. … By contrast, accrual accounting calls for the recognition of debt as it is incurred, not only when ‘payments are due.’ Please reject this proposed concept statement. I urge you to help solidify the public trust by bringing honesty and transparency to government financial reporting.”
Andrew Abramczyk of the Commonwealth Foundation offered stinging and cogent observations, like these:
"The proposed changes disfavor policy-oriented users of government accounting information in favor of liquidity-oriented users like internal planners and lenders. Worse, they cause financial statements to misrepresent a government’s financial position by ignoring noncash costs. The changes even elide the difference between regular revenue and borrowing proceeds, allowing a government that has borrowed to fund operations to claim it is in fiscal balance. The changes will thus compound and worsen the state of U.S. public finance … We are puzzled by GASB’s deliberate departure from the principles of accrual accounting."
If you thought "elide" was a typo, you weren't alone. But here's what it means, from Merriam-Webster: "to suppress or alter by elision." And "elision?" Again, from the dictionary: "the act or an instance of omitting something."
GASB’s proposals may not seem rational or, at least, logically well-grounded. But they may be very rational, in light of how the public choice school of economics views the driving forces for government officials and regulators. In economics, people are assumed to be rational -- not that they can add 2+2 and get to 4 all the time, but in the sense that they are self-interested. People want to make themselves better off and that’s what drives their decisions. In turn, the public choice school of economics encourages us to consider that government officials and regulators may not be working, first and foremost, for the general welfare – they may be rational and self-interested, like the rest of us. In turn, the prediction is that well-organized special interest groups dominate policy (including governmental accounting policy) at the expense of citizens, taxpayers, and the common good.
I have to speculate, if not assume, that GASB has been catering to a coalition of focused interest groups that can include politicians and financial services providers to governments (like bond underwriters and credit rating agencies), but at the expense of the general welfare as well as notions of “interperiod equity” and “fiscal accountability” that GASB has been asserting as grounds for its proposals.
Are public pensioners and taxpayers paying for investment performance?
July 23, 2021
There aren’t a lot of $100 bills lying around on sidewalks. If they were there, somebody would have picked them up.
That’s the kind of reasoning underlying the “efficient markets hypothesis” in finance. It isn’t easy to beat the market because if it were easy, somebody would have already done it.
Granted, markets aren’t always right, either. Crowd psychology and public policy can move things around in ways that aren’t always right, or at least, sustainably right.
But markets are hard to beat – and in turn, paying experts lots of money to try to beat the market may not make a lot of sense if, on average, they can’t do it.
Yet for public pensions, we pay lots and lots of experts lots and lots of money to do what they, collectively, can’t do on average. Is this irrational? Not if rationality means that well-organized interest groups dominate public policy, including public pension design and investment management, in ways that enrich a few at the expense of the many.
Citizens and taxpayers have a direct stake in the management of public pension assets. Particularly in places like Illinois, where an Illinois Supreme Court ruling a few years ago cemented the obligations of governments to retirement plans. If risky investment strategies are employed, taxpayers and citizens are exposed to the downside to make up any greater shortfall that arises.
In turn, those investment strategies also matter for taxpayers if the riskier and/or less-transparent management costs a lot of money for generally-overpaid experts who are drawing on the public purse.
As woefully underfunded as many public pensions are, it bears underlining that they are only underfunded in relation to the massive liabilities that many state and local governments have accumulated. These plans manage many, many billions of dollars in invested assets.
Consider the Teachers’ Retirement System (TRS) of Illinois. At its latest fiscal year-end, the plan reported a funded ratio of just 39 percent, meaning that it had less than four dollars in assets for every $10 in the present value of promised benefits. TRS reported a total liability for the plan at fiscal year-end 2020 of $136 billion, backed by “just” $52 billion in invested assets.
Fifty-two billion dollars is still a lot of dough. Paying folks to manage it can cost taxpayers and pensioners a lot of money.
So we should have good information about how much it costs to manage pension assets, right?
Wrong.
Let’s take a peek at another Illinois plan – the Policemen’s Annuity & Benefit Fund of Chicago, the retirement plan for Chicago cops. At year-end 2020, the plan had more than $2.7 billion in investments, but the plan’s “fiduciary net position” was only about one-fifth of the present value of its promised benefits. Here’s what the latest audit report had to say about disclosure of investment fees:
Investment management fees from equity and fixed-income managers, including one of the collective funds, one of the private equity managers, and the cash manager, are included in investment management fees on the statements of changes in fiduciary net position. Investment management fees from all other collective funds, short-term investments, infrastructure, hedge, real estate, venture capital and private equity are reflected in the net investment income from such investment products. Such investment management fees are not significant to the financial statements.
At year-end 2020, this fund had about $800 million in “collective investment funds,” $220 million in hedge funds, $140 million in real estate investments, $110 million in venture capital and private equity investments, $100 million in short-term instruments, and $68 million in “infrastructure” investments. If experts were being paid two percent (annually) of the $1.4 billion in those investments, it would amount to about $30 million a year.
But we don’t know what the true compensation rate is because “such investment management fees are not significant to the financial statements.”
Back in 2019, a study by Oxford University finance professor Ludovic Phalippo indicated that Pennsylvania’s two largest public pension funds paid out more than $6 billion in fees and related compensation to investment managers over one decade, about three times as much the systems had been disclosing, importantly due to issues related to profit-sharing arrangements with private equity firms.
More recently, the trustees of Pennsylvania’s largest pension fund confirmed in April 2021, in response to a reporter’s inquiry, that it was under federal investigation for related issues about calculating investment performance and investment transactions potentially related to “kickbacks and bribery.”
Coincidentally or otherwise, in March 2021, the staff of the Government Accounting Standards Board (GASB) prepared a research paper on investment fees in public pension plans, with a view to informing the GASB Board about issues that have been raised about investment fee disclosure. But in April 2021, GASB voted to not add the issue to its Technical Agenda.
We will be taking a closer look at that paper soon.
No such thing as a free lunch, or a free newspaper
July 29, 2021
I just got back from lunch. Normally, I like Italian beefs, but this was an alarming and depressing lunch.
First off, it cost nearly $13 for an Italian beef, fries, and a drink. Inflation is a tax, but my meal also cost me more than a buck just for the sales tax.
It was especially alarming and depressing, however, because I paid a buck at another place first, to get a Chicago Sun-Times to go with my lunch. And almost every single article in the news section of “The Hardest Working Paper in America” related to government operations, to the coercive power of the State, and to my tax dollars.
The front page of the paper featured a main story about the Chicago Public School system’s preparation for fall, with a photo of the system’s CEO wearing a mask. Page two had a story about how the Illinois Boycott Restrictions Committee of the Illinois Investment Policy Board plans to warn Ben & Jerry’s of possible consequences for the company’s decision to stop selling ice cream in east Jerusalem and the West Bank in Israel. Page eight had a full-page article for the lead article on the front page, about how the interim Chicago Public Schools CEO has a top goal to enroll students at risk of leaving the school system. The Chicago Public School (CPS) system has had declining enrollment for years, and the system plans “city-wide marketing campaigns, home visits and intensive summer programming” to try to stem the decline. The system has recently been supported by “$1.8 billion in federal relief funding.”
Page 12 had a long story about how one government agency is investigating another government law enforcement agency, but did not cover how much money was being spent in this process or where it was coming from. This story had a story next to it about a man who was shot to death after he pulled a gun when federal marshals were trying to arrest him. Page 13 had an article about how the federal Environmental Protection Agency has been working to “make sure that the state sets strict rules” for the operation of an asphalt plant. The costs of potentially moving the plant have been a matter of dispute, including issues relating to how much public funding might be involved. This article was followed by an article about how Dr. Anthony Fauci is scheduled to be a speaker at a forthcoming convention for the Rainbow/Push Coalition that is titled “Beyond Freedom to Equality: Leveling the Playing Field in the Era of COVID.”
This is not a complete list.
There’s no such thing as a free lunch. Or a free newspaper.
The infrastructure pandemic pension bailout
August 6, 2021
Money is fungible.
Federal government grants to state and local governments may be targeted for specific purposes, but once that money arrives, it frees up money for other purposes.
The massive federal dollars arriving in the form of pandemic “relief” and soon-to-arrive “infrastructure” spending will similarly help to free up sources of funding for massively underfunded public sector pensions in state and local governments.
Some critics of the federal infrastructure proposals have focused on how the definition of “infrastructure” has been broadened to include social programs on top of traditional brick-and-mortar spending on roads, bridges etc.
But the broadening need not be explicit, for example, in including child care in a definition of infrastructure. When the federal government provides states and cities more dollars for infrastructure projects, it helps to free up funding for other uses, including pensions.
Meanwhile, government grows and grows. So does the federal debt.
Does municipal bankruptcy curtail local economic growth?
August 12, 2021
We recently updated our Data-Z website to include 2020 data for single-family housing permits in the 75 largest cities in the United States. I just took a peek at Chicago and compared it to Detroit and Stockton since 2009 (the bottom of the 2007-2009 housing and financial crash).
The chart below shows permits for new homebuilding in those three cities, based on data we index to 2005=1. We index the data to help compare cities of different sizes.
Back in 2009, housing permits had fallen in all three cities to just 10-15 percent of where they were in 2005, before the housing crisis. They have since been recovering, but much faster in Stockton and Detroit than in Chicago.
All three of these cities have had governments with historically bad financial positions. But in 2012, Stockton declared bankruptcy, and new home construction rose dramatically after that. A year later, Detroit chose the same path.
City governments are organized as municipal corporations, so they may have the option to reorganize under Chapter 9, a federal bankruptcy law. However, that law provides that cities may only do so if they have specific authority from the state. In Illinois, that authorization has not been granted.
Perhaps it should have been (be) granted?
Senate oversight hearing for state and local accounting standards needed now
August 13, 2021
The Senate Banking Committee should hold an urgently needed oversight hearing on developments at the Governmental Accounting Standards Board (GASB), which sets the accounting standards for state and local governments.
In recent years, GASB has embarked on projects that have led to the issuance of Exposure Drafts currently under board deliberation. These proposals would lead to a new concept statement and accounting standard. They would effectively reinforce, and attempt to establish an ill-founded conceptual basis for, unsound and deceptive accounting practices by state and local governments in the United States.
GASB’s proposals relate to financial statements for governmental funds. Longer story short, the proposals are for an oxymoron-ish “short-term financial resources measurement focus and accrual basis of accounting,” essentially a cash-basis mode of accounting that has enabled practices like borrowing money and underfunding pensions as means for “balanced budgets,” as many state and local governments have run up huge tabs on their taxpayers anyway.
By the standing rules of the United States Senate, the Senate Committee on Banking, Housing and Urban Affairs (Senate Banking Committee) has jurisdiction over “banks, banking and financial institutions,” “economic stabilization,” and “federal monetary policy, including the Federal Reserve.” The Senate Banking Committee has five subcommittees, including:
Economic Policy … with jurisdiction for “economic stabilization.” The Chair of this subcommittee is Sen. Elizabeth Warren (D-MA), and the Ranking Member is John Kennedy (R-LA).
Financial Institutions and Consumer Protection … with jurisdiction for banks and other financial institutions. The Chairman of this subcommittee is Sen. Ralph Warnock (D-GA) and the Ranking Member is Sen. Thom Tillis (R-NC).
Securities, Insurance and Investment … with jurisdiction for government securities, the SEC, and accounting standards. The Chairman of this committee is Sen. Robert Menendez (D-NJ) and the Ranking Member is Sen. Tim Scott (R-SC).
The issues calling for intensified Senate oversight of GASB relate to all three of these realms of jurisdiction, suggesting that a full Senate Banking Committee hearing could be warranted. Alternatively, it could be in one of these subcommittees.
For the Economic Policy subcommittee, the issues matter for economic stabilization, particularly in light of the recent massive federal aid for many state and local governments that were ill-prepared for the pandemic and economic disruptions from government lockdowns.
For the Financial Institutions and Consumer Protection subcommittee, the issues matter for banking and other financial institutions, particularly in light of the rapid growth in bank lending to state and local governments in the decade before the arrival of the pandemic.
For the Securities, Insurance, and Investment subcommittee, the issues matter for government securities (including municipal government securities), the SEC, and accounting standards, particularly as the U.S. Congress has delegated responsibility for generally accepted accounting principles to the SEC, which in turn has delegated authority through the Financial Accounting Foundation to the Financial Accounting Standards Board (FASB) and to the GASB.
Early last year, a subcommittee of the Financial Services Committee of the U.S. House of Representatives held an oversight hearing for issues at FASB. Given the gravity of the issues underneath the rock that GASB has rolled over, it’s time for Congress to oversee them today.
Chicago’s leaders ran up credit cards on Chicagoans. How much does it cost?
August 26, 2021
The City of Chicago has accumulated massive debts, even as it has long told its citizens that it balances the budget every year as required by state law. It has sold billions of dollars of long-term bonds and distributed billions of dollars of unfunded promises for retirement benefits for its employees. It has borrowed lots of short-term money too, from suppliers as well as banks and other lenders.
Money isn’t free. It costs money to get money. That’s called interest. So how much interest expense is Chicago incurring every year? How much does that compare to a neighboring city, for example, Indianapolis?
This isn’t such a simple question as one might hope, for such an important question.
Let’s take a peek at Chicago’s income statement (see p. 34). For state and local governments, that’s called the “Statement of Activities.” Chicago’s income statement has included an expense line item titled “Interest on Long-term Debt.” In 2020, that amount was reported to be $620.3 million, or about $230 for every man, woman and child in the city.
The income statement (p.28) for the City of Indianapolis reported $50.3 million for a similar line item in 2020. On a per-capita basis, that amounted to $57, or about one-fourth of the load for Chicagoans.
There’s at least one distinction worth noting, however, in comparing these line items between Chicago and Indianapolis. The line item for Indianapolis is titled simply “Interest,” not “Interest on Long-term Debt.”
You can compare Chicago to Indianapolis on another dimension relating to their respective interest burdens. That comes from a different financial statement, an underlying “funds” statement called the “Statement of Revenues, Expenditures, and Changes in Fund Balances.” Governments provide these statements for both “Governmental” and “Proprietary” funds. In 2020, Chicago reported $593.6 million in “Interest and other Fiscal Charges” for its governmental funds, and $554.7 million in “Interest Expense” for its proprietary funds. Indianapolis reported $76.9 million for this item (“Interest on Bonds and Notes”) in its governmental funds in 2020, and no interest expense for its proprietary funds.
Adding up governmental and proprietary funds, then, Chicago reported $1.1 billion in total interest expenditures in its funds statements in 2020, about 15 times as much interest (on this basis) as Indianapolis.
Stepping back from this tedious math for a minute, consider a simple fact. Last year, the City of Chicago had more than $1 billion in INTEREST EXPENSE ALONE.
In contrast to the $620.3 million in “Interest on Long-Term Debt” that Chicago reported on the overall Statement of Activities in 2020, Chicago included a footnote disclosure that identifies the “total interest expense incurred by the city.” In 2020, that came to $1.3 billion.
The chart below compares this annual amount included in the footnotes to long-term interest rates in the United States since 2003, the first year that Chicago currently has for its historical annual financial reports on its website.
From 2003 to 2020, long-term interest rates fell 80 percent, to less than one percent, yet during the same period the City of Chicago’s interest expense more than doubled, climbing above $1 billion a year. And from 2003 to 2020, Chicago’s total interest expense rose ten times faster than it did in Indianapolis.
So much for “balancing the budget” every year.
Meanwhile, after the onset of the pandemic last year, Chicago’s debt load has increasingly become a load not only for Chicagoans. Massive federal government “relief,” “rescue,” and “stimulus” dollars have arrived, indirectly sharing Chicago’s burden with the rest of America.
That $1.3 billion in interest expense may be a load for Chicagoans and other taxpayers, but it is the opposite of a load for some other people. Those are the people getting paid the interest. Who are they, and what influence do they have on Chicago (and U.S.) financial policies?
Illinois’ plunge into financial abyss: How bad is it?
August 31, 2021
In late August, the State of Illinois released its annual financial report for fiscal year 2020 – which ended June 30, 2020. In other words, we just learned about the results for a year that ended more than 400 days ago.
How did Illinois do?
Old information is still information, even if it’s all we have. And in Illinois’ case, the information isn’t just old, it is clouded by the arrival of a newly-qualified auditors’ opinion on the financial statements.
Still, it’s all we have. So, what exactly do we have?
Based on the reported balance sheet, Illinois’ overall financial condition deteriorated further, and at a faster rate than it did in 2019. Illinois primary government net position fell from a $187.7 billion deficit in 2019 to a $194.4 billion deficit in 2020, a greater decline than in 2019, and a result shared by looking at measures like the patterns in the unrestricted net position and the net position excluding deferred outflows and deferred inflows.
The June 30, 2020 fiscal year was certainly a strange year. It included the arrival of a worldwide pandemic in March 2020. So, Illinois’ 2020 report only included three months of pandemic impact – both negative and positive (in terms of federal government support for the state and its governments).
Truth in Accounting will release its full report on 50 state results in 2020 soon, now that Illinois’ results have finally arrived (We are going to go ahead without California, which is even more woefully late than Illinois).
Taking a longer-look back, however, how bad has Illinois’ financial position become?
Tracking changes in the net position on the balance sheet is one of the best indicators of financial performance we have for state and local governments. The balance sheet net position is based on more reliable accrual-accounting basis, as opposed to unreliable cash-basis-like accounting for government funds statements.
Unfortunately, for a longer-term perspective, the reported balance sheet net position can be a misleading indicator, given fundamental changes in accounting for pensions and retiree health care benefits in recent years.
Here’s a look at Illinois’ reported primary government net position since 2002.
It looks pretty ugly. But it’s not as bad as it looks, even though some use this picture to illustrate how bad things have gotten. The problem is that with the long-tardy but welcome recognition of massive liabilities for pensions and retiree health care benefits in 2015 and 2018, the reported net position dropped seemingly calamitously. Granted, state and local governments should have been reporting those debts earlier, but the reported net position decline overstates the “true” financial deterioration.
So, how has Illinois done, from a longer-term perspective, adjusting for those accounting changes?
Truth in Accounting has been analyzing and publishing a net position adjusting for pensions and retiree health care benefits every year since 2009. TIA anticipated (and led) the changes in government accounting standards. Which means that TIA’s estimate of net position (“Taxpayer Burden”) has been prepared on a consistent basis over time, allowing a more valid perspective than using governments’ reported net positions.
So, how does that picture look for Illinois? Unfortunately, it’s still pretty ugly.
From 2009 to 2019, on a per-taxpayer basis, Illinois’ “Taxpayer Burden” fell from less than $30,000 (per taxpayer) to more than $50,000 (per taxpayer). Over this interval, the 50-state average we calculate stayed relatively constant.
It’s important to take note of the starting point in that chart – 2009, amidst the worst economic and financial crisis (up to then) since at least the Great Depression. Illinois’ overall financial position deteriorated dramatically from 2009 to 2019, despite huge rallies in investment markets that benefitted Illinois’ woefully underfunded retiree benefit plans.
Truth in Accounting will soon release a full report on the 2020 financial results for the 50 states, including Illinois.
Social Security, Medicare Trustees’ reports suggest further deterioration in the ‘true’ national debt
September 2, 2021
The U.S. Treasury Department released the annual Social Security and Medicare Trustees reports yesterday. The Social Security Trustees estimated that the “Trust Fund asset reserves” will be depleted in 2034, a year earlier than estimated last year. Setting aside important questions whether the “Trust Fund” is really a trust, and whether it really has funds in it, the present value of the excess of future payments over dedicated tax revenue increased significantly, another sign of deterioration.
We will be analyzing the implications of these reports for our estimate of the ‘true’ national debt more closely. But stepping back from that, the report included a notable continuing omission – names for the two public trustees.
There are six Trustees, theoretically. Four are selected for the positions in government, including Treasury Secretary Janet Yellen (Managing Trustee), Kilolo Kijasaki (Acting Commissioner of Social Security), Xavier Becerra (U.S) Secretary of Health and Human Services), and Martin Walsh (U.S. Secretary of Labor).
There are also supposed to be two “public” trustees. But those positions have been vacant since 2015.
Charles Blahous was one of the last public trustees to fill that position. Back in February 2020, Blahous wrote an op-ed in The Hill titled “It’s time to seat public trustees for Social Security and Medicare.” Blahous argued:
Being independent from the administration, expert in the programs, appointed for fixed four-year terms, and members of different political parties, they have provided confidence to policymakers and the public alike that the analysis and financial projections contained in the annual trustees’ reports are objective and of the highest quality. … Not only do the public trustees affirm the credibility of the trustees’ financial reports, but they also help to communicate, in a dispassionate way, the state of the trust funds to the public.
… Most importantly, each year that policymakers delay, the financial imbalances grow and the options to fairly address them dwindle. We should not go another year without experts in these public trustee positions who will represent the public interest, provide Congress with critical information and facilitate the urgent conversations that can bring about reform.
But another year, and more, has come and gone.
Perhaps we could take this as an opportunity to truly advance the independence of the public trustee positions. Rather than choose “members of different political parties” (Republicans or Democrats), this could be a good time to cement nonpartisan, rather than bipartisan, public trusteeship.
When up is down: A post-Labor Day look at public-sector unions and pension funding
September 7, 2021
Labor Day first became a federal holiday in the late 1800s. It has since become a statutory holiday in all 50 states, reflecting the influence of organized labor. Now that our day off yesterday is over, let’s take a look at one lay of the land – and a very curious tendency for states with strong public-sector unions.
At our Data-Z website, we include data from the Union Membership and Coverage Database. That database tracks the percent of workers covered by collective bargaining agreements (CBAs) in both the private and public sectors. Since 1983, the 50-state average for the private sector share has fallen from 16 percent to 7 percent, but in the public sector, it has only fallen from 42 percent to 36 percent, and actually rose in 2020.
There is wide variation among the 50 states in the unionization of public sector workforces. What does the condition of state government finances -- and public sector pensions specifically -- look like in strong public sector union states compared to other states?
One might expect pension funding to be stronger in states with stronger public sector unions. And one would be wrong.
The 50 states can be ranked on the share of public sector workers covered by CBAs in 2020, and put in three groups – the 15 states ranking highest, the 15 states ranking lowest, and the 20 states in the middle of the pack. The 15 states ranking lowest had an average of 17 percent share, down from 28 percent in 1983. The 15 states ranking highest had a 60 percent share, just down a smidgeon from a 61 percent average in 1983. For the 20 states in the middle of the pack, the share was 33 percent in 2020, down from 39 percent in 1983.
What do these three groups look like, in terms of their average public sector pension funding ratios and overall state government financial conditions?
The 15 states with higher unionization in the public sector had significantly lower, not higher, pension funding ratios in 2020 than either of the other two groups, and those funding rations fell significantly more from 1983 to 2020 in those unionized states. This curious result was even stronger for looking at the bleak status of public sector retiree health care benefit plans.
And when looking at Truth in Accounting’s “Taxpayer Burden” measure of overall financial condition, the unionized states tend to have state governments in significantly worse shape, and their condition has deteriorated significantly since 2009, in contrast to those other two groups. Here’s a look at the average TIA Taxpayer Burden for the three groups:
2009 2019
Less unionized -3,300 -500
Middle of the pack -7,100 -2,300
Most unionized -15,900 -20,700
Social Security – flooding the airwaves with deceptive messages?
September 14, 2021
Greg Visscher, one of our readers and supporters, recently got in touch with us after hearing a 15-second radio ad in the Washington, DC area. You can listen to this brief message, too, at this link.
The message was from the Social Security Administration. Greg recalls that the station called it a “taxpayer funded” message.
The words in the 15-second ad are:
Millions open a “my Social Security account” every year, so they can prepare for retirement. Social Security – securing today, and tomorrow. See what you can do at SocialSecurity.gov.
The front page of that website has a click-through tab titled “my Social Security” (with the “my” in italics). Clicking on that tab brings you to a page featuring the following image …
… with an invitation to “Create your personal my Social Security account today.”
Greg has been aware of our concerns about Social Security messaging, including the first version of their “My Social Security” webpage. Back in 2017, I took note of that new webpage, which featured this image (and some wording on the image).
The previous wording (on the image of the young man looking out over the ocean) was:
Set yourself free. Open a my Social Security account today and rest easy knowing that you’re in control of your future.
That image was replaced with the current one (with new wording) sometime in August 2018. The current messaging isn’t so ambitious, which is a good thing.
The federal government chooses to exclude tens of trillions of dollars of unfunded Social Security obligations as debt on its balance sheet, and the reason it clings to when trying to justify this practice runs along the lines of “the government controls the law, and can change the benefits at any time.”
In other words, maybe we shouldn’t rest easy, knowing we are in control of our future.
For that matter, maybe they should stop calling it “my Social Security account,” too.
How many radio stations are they paying to run these ads?
Illinois and Iowa – the Mutt and Jeff of ‘balanced budgets’
September 28, 2021
Forty-nine of the 50 states have “balanced budget” requirements, either as a matter of their state constitution or state laws. Yet some states, like Illinois, have run up massive debts anyway.
At Truth in Accounting, we recently updated our Data-Z website to include the latest available audited annual financial report information for the 50 states, as part of our annual Financial State of the States project (and publication).
One element in the “State Financial Data” section is “Net Revenue (Change in Net Position).” This amount measures the difference between revenue and expense. Budget accounting can be pretty flimsy stuff, but “Net Revenue (Change in Net Position),” which comes from accrual-accounting-based government wide financial statements, is a relatively reliable indicator. When it is positive (above zero), a state government has effectively walked the talk on balancing the budget.
Here’s a look at a chart comparing Illinois to next-door-neighbor Iowa on “Net Revenue.”
Iowa (the blue line) maintained positive net revenue in 15 of the 16 years. Illinois, on the other hand, did so in only three of those 16 years.
The frequency of truly-balanced-budgets, as indicated by “Net Revenue,” provides significant explanatory power (in econometrics-speak) for two important measures of state government performance – Truth in Accounting’s “Taxpayer Burden” measure of overall financial condition and rankings of the states on the latest Gallup results for a survey of trust in state government.
In our latest (2021) Financial State of the States report on state government finances, Iowa ranked 9th, while Illinois ranked 48th. And in the latest Gallup poll on trust in state government, Iowa ranked 8th, while Illinois ranked 50th (dead last).
Counting heads gets harder during a pandemic - unless it gets easier
October 20, 2021
The United States Census Bureau will deliver new population estimates for 2020 in November 2021. But it has cautioned people against using them, while trying to inspire confidence in a different headcount that itself deserves closer scrutiny. Trillions of dollars are at stake over the next decade, as well as control of Congress and the Electoral College.
By way of background, the Census Bureau provides two main population counts for the United States. They include annual population estimates based on sample surveys, and a complete “census” count once every 10 years. The annual estimates come from the American Community Survey (ACS) program, which is based on sample surveys covering a fraction of households. The once-a-decade (“decennial”) complete census totals are a much more extensive effort, theoretically covering everyone in America.
The decennial census results are used to determine apportionment – the number of seats a state holds in the House of Representatives. So the decennial census effectively determines the number of electoral votes for each state since each state has as many ‘electors’ in the Electoral College as it has Representatives and Senators in the United States Congress. The decennial census totals matter for other critical policies, including the distribution of hundreds of billions of dollars of federal funding for state and local governments annually.
In other words, those decennial census numbers are pretty darn important. But the annual population estimates matter, too, given that many government decisions are based on more timely population information.
The legal foundations for the decennial census were first laid in Article I, Section 2 of the U.S. Constitution, which called for an “Enumeration” of “the whole Number of free persons … and excluding Indians not taxed, three fifths of all other Persons.” The Enumeration was designed to provide the means for determining the number of Representatives for each state. The “three-fifths” calculation no longer applied after the Civil War and the end of slavery.
The annual ACS survey results are based on samples, not complete totals, and therefore are subject to sampling error. Describing the interpretation of annual survey results and census totals, the Census Bureau has stated that “Differences between the estimates and census counts are interpreted as error in the estimates and not the census counts.” This assumption may include or imply misplaced confidence in the decennial census totals, however.
In 2020, the ACS was only able to gather two-thirds of the responses it normally collects in the annual survey process. In late July 2021, the Census Bureau announced it would not release the annual ACS estimates for 2020, given the impact of the pandemic on its ability to accurately gather required information. Instead, the Bureau announced it would begin to issue “experimental” annual estimates, starting in November 2021. But it cautioned that those estimates should not be considered as replacements for the annual ACS totals.
In late July, the Census Bureau also issued a statement about the differences between the decennial Census totals and the ACS one-year estimates. The statement asserted the Bureau was able to “overcome pandemic-related challenges” in the decennial count, in contrast to the annual ACS survey, by “pouring additional resources into ensuring response.”
In recent days, however, the decennial count has come under increased scrutiny. On October 9, NPR reported that it had learned that the Census Bureau was planning to postpone and extend a follow-up quality-control survey for the decennial census, called the “Post-Enumeration Survey,” given growing concern about data quality. The Census Bureau’s “Press Releases” page on its website shows no announcement of this decision. And on October 13, in a story headlined “2020 Census may have undercounted Black Americans,” the Washington Post’s Tara Bahrampour reported that “the 2020 Census was fraught with challenges.” She included an assertion from a Democratic legislator from Michigan that “It was a perfect storm for an undercount on many levels,” and a statement from the CEO of the National Urban League that “this might be our greatest undercount since 1960, or 1950.”
Back in 2019, on the other hand, I took note of a developing “get-out-the-vote” campaign for the Census in Illinois. I questioned whether the Census Bureau had to manage the risk that some states, amidst intensifying fiscal stress, might be more motivated to “get out the vote” than others. More recently, on April 29, 2021, after the decennial results came in, I wrote an article titled “Did get-out-the-vote campaigns bias the Census -- and apportionment -- results?” I took a hard look at the differences between the “actual” decennial census totals and the annual ACS survey results. States with significantly higher 2020 decennial census results than those to be expected from the ACS estimates from 2010 to 2019 (before the pandemic hit) tend to be financially-challenged, and Democratic, states.
Meanwhile, a seemingly-reputable review by a task force established by the American Statistical Association recently concluded that it couldn’t reach a conclusion about the quality of the data delivered in the 2020 Census. It stated that “indicators released to date by the bureau do not permit a thorough assessment of the 2020 Census data quality.” Nonetheless, the task force report offered the following double-negative vote of semi-confidence: “Across the limited set of state level process statistics evaluated by the task force, it found no major anomalies that would indicate census numbers are not fit for uses of apportionment.”
Government accounting includes counting heads as well as dollars. And counting heads is not as easy as it may seem. Appraisals of the 2020 decennial census as well as annual population totals deserve close attention in coming months. There is a lot of money and power at stake in these numbers -- and where there is a lot of money and power at stake, political forces gather like bees on honey.
Look out for Zombie States – not only on Halloween
October 25, 2021
We have updated our annual “Zombie Index” for state governments, based on our recently-completed survey of their latest audited financial reports. The Zombie Index identifies states that may have incentives to accumulate riskier investment portfolios in pension and other employee retirement benefit plans. Taxpayers and citizens have reason to be spooked, especially given financial market history lessons from the likes of the savings and loan (S&L) crisis in the 1980s.
We call it the “Zombie Index” based on the work of Edward Kane, a prolific and respected finance professor at Boston College. Back in 1985 and 1989, Ed wrote two books warning about taxpayer exposure to losses from bank deposit insurance schemes, before we knew what hit us in the savings and loan crisis. Ed coined the term “zombie bank” to identify effectively-insolvent banks that were allowed to remain open by regulators and others. Deceptive accounting principles greased the wheels for regulatory forbearance, making “zombies” appear to be solvent.
Zombies had incentives, in Ed’s terms, to “gamble for resurrection.” Insiders could capture the upside of riskier investments, while prospective losses could be socialized through the government’s sponsorship (and ultimately, bailout) of deposit insurance systems. These incentives ended up magnifying taxpayer losses during the 1980s deposit insurance crisis. Those losses ran in the hundreds of billions of dollars and helped set the stage for the massive financial crisis of 2008-2009.
Let’s hope we aren’t repeating history with state and local government pension plans today.
Our “Zombie Index” is based on six equal-weighted factors:
Truth in Accounting’s “Taxpayer Burden,” which is a per-taxpayer measure of overall state government financial condition. States with a Taxpayer Burden have negative net financial positions, on our accounting, and the larger the Taxpayer Burden the greater the depth of “insolvency.”
The change in TIA’s “Taxpayer Burden” since 2009, to capture the degree of financial deterioration (or improvement) since then.
The timeliness of states in issuing their annual audited financial statements. The greater the delay, the higher the “Zombieness.” (Note: California has yet to release its fiscal year (June) 2020 financial report and deserves special attention on this score.)
The difference between balance sheet-reported and actual retirement benefit liabilities in 2014, the year before the Governmental Accounting Standards Board finally began requiring those benefit obligations to appear as debts on the Statement of Financial Position. The accounting has been “fixed” since then, but the 2014 difference can still help capture Zombieness.
The degree to which state governments are still underreporting retirement benefit obligations on their balance sheet, for example, by using (as allowed) one-year-lagged results for their pension plans.
The extent to which governments are reporting potentially-misleading and confusing “Deferred Outflow and Inflow” accounts, which can be managed to artificially bolster reported net positions in the short-run.
We rank the states on each of these factors, compute an average of the rankings on the six factors, and then rank the states on that average. When states are still tied, we break the tie using factor number two above, the change in TIA’s Taxpayer Burden since 2009.
In our latest analysis, the ten scariest Zombies were (in order from frightening to terrifying) Hawaii, Pennsylvania, California, Vermont, New Mexico, Delaware, Connecticut, Massachusetts, Illinois, and (the biggest Zombie) New Jersey. Citizens and taxpayers in those states should be concerned about the riskiness of the investment portfolios for pension and other retirement benefit plans.
But citizens and taxpayers in all 50 states should be concerned -- not just for their own states, but for Zombie states as well. That’s partly why we developed the index. The potential socialization of losses through federal schemes impacts all Americans, exposing citizens and taxpayers in well-managed states to the troubles facing Zombies.
You can review our state “Zombie Index” rankings at our Data-Z website. For example, here is a chart comparing the rankings for Illinois, Massachusetts and New Jersey to Utah, South Dakota and Idaho. Or click below to watch a short video on the rankings.
California’s ‘surplus’ – Exhibit A in deceptive ‘kick the can down the road’ budgeting
November 1, 2021
California ranked 42nd out of the 50 states on its fiscal health in Truth in Accounting’s latest Financial State of the States report. California’s state government has accumulated more than $250 billion in unfunded bonds, employee pension, retiree health care, and other liabilities. This huge hole is more than $100 billion deeper than it was back in 2009 – despite the fact that we’ve had a significant economic recovery since then, including a massive recovery in financial markets (and the investments supporting California government employee pension plans).
Yet just a week ago, California Governor Gavin Newsom announced that the state would have a “historic budget surplus” next year.
How can A + B = C?
The answer (of sorts) arrives in government accounting standards, and in particular, standards for “governmental funds” used in the budgeting process.
There are words, and there are deeds, the old saying goes. Budgets are prospective planning documents, while Truth in Accounting’s annual financial analyses are based on accrual-accounting-based government-wide financial statements – the results.
Unfortunately, we are being charitable with California, given that it was the only state so slow (it still hasn’t released its June 2020 financial statements yet) that we had to use 2019 results.
But budget data, like those recently cited by Newsom, aren’t necessarily better because they are more timely. In fact, the opposite can be true – they are more timely because they are cash-accounting-based numbers, which ignore the accumulation of long-term debt in retirement benefit plans to reach a “surplus” conclusion.
Let’s take a brief but creative look at an October 27, 2021 report from the California Legislative Analyst’s Office, titled “The 2021-2022 Budget: Overview of the Spending Plan.”
The word “surplus” appears 17 times.
The word “debt” appears twice.
The word “deficit” doesn’t appear once.
The word “liability” doesn’t appear once.
The word "spend" appears 75 times, either by itself or in other words.
The first time the word “surplus” appears in a sentence, it is in this one:
“A surplus occurs when, over the three-year budget window, the state collects more in General Fund revenues than it requires to meet its existing obligations.”
This helps illustrate the deceptive nature of governmental fund accounting standards and budgeting communications. “Existing obligations” are defined to not include obligations due in the window, when massive and real obligations still exist, under a longer time horizon.
Do consumers cause inflation? Yes and no
November 11, 2021
Yesterday morning, the U.S. Bureau of Labor Statistics (in the Department of Labor) issued their latest monthly report on the Consumer Price Index. The first online Wall Street Journal covering the story was headlined “U.S. inflation reached 30-year high in October.” The first two sentences in that story were:
U.S. inflation hit a three-decade high in October—rising at a 6.2% annual rate—as pandemic-related supply shortages and continued strength in consumer demand continued to push up prices. The Labor Department said the consumer-price index, which measures what consumers pay for goods and services, increased at the fastest annual pace since 1990.
My “Morning Call” newsletter included this story right after it came out, and noted:
The first two sentences in this article a) assume the CPI is inflation, and b) blame consumers and pandemics, not government policy, for inflation. TIPS – “Treasury Inflation-Protected Securities” protect investors not from inflation, directly, but the CPI – a government statistic that is subject to ambiguity and discretion.
I was showing this story to my finance students at Loyola U. Chicago in the early afternoon yesterday, but the WSJ story no longer included those two sentences. They had been “updated.” Today’s hard-copy WSJ features the story at the top of the front page, in a story headlined “Inflation Rate of 6.2% Marks a 31-Year High.” The first sentence in that story (online version here) now reads as follows:
U.S. inflation hit a three-decade high in October, delivering widespread and sizable price increases to households for everything from groceries to cars due to persistent supply shortages and strong consumer demand.
So consumers are now viewed closer to how they should be – the consumers of inflation as well as goods and services. Inflation is quite arguably a regressive tax, at odds with the Biden administration’s claims that it would only raise taxes on rich people. But the WSJ is still identifying ‘persistent supply shortages’ and ‘strong consumer demand,’ not fiscal and monetary policy, for inflation.
Illinois’ unmodified modified audit opinion on its financial statements
November 16, 2021
Today, Truth in Accounting released “Financial Transparency Score 2021,” our annual report scoring the 50 state governments on financial transparency. We survey the audit opinions for all 50 states as part of the scoring process, and only 37 states earned clean audit opinions, 10 fewer than last year. All states had to overcome special factors impacting information processing with the pandemic and interruptions to normal operating practices, and more than a few states apparently struggled in particular with financial reporting for unemployment insurance programs.
Illinois was one of the states that failed to achieve a clean, or “unmodified,” opinion. Issues associated with acccounting for unemployment insurance benefits were part of the problem, but Illinois also had new issues in accounting for retirement benefits for the state tollway authority.
You can view Illinois’ Comprehensive Annual Financial Report for 2020 here. The “Independent Auditor’s Report” starts on page 11 of that report. Frank Mautino, Auditor General of the State of Illinois, listed eight different audit opinions for different “opinion units” within the overall report. Five of the eight units received unmodified opinions, while three received “qualified” opinions, relating to the unemployment insurance and tollway retirement benefit issues.
Yet in her letter of transmittal for the overall report, Illinois State Comptroller Susana Mendoza stated, quite bluntly:
The Illinois Auditor General has performed an audit of the accompanying basic financial statements in accordance with generally accepted auditing standards in the United States of America and Government Auditing Standards issued by the Comptroller General of the United States. His unmodified opinion appears at the beginning of the financial section of this report.
Maybe getting unmodified opinions on five out of eight opinions makes an overall opinion unmodified. Majority rules! This is democracy, after all.
On the other hand, this could be negligence, or worse. Maybe it was just an oversight. But if three qualified opinions mean an overall opinion should not be called “unmodified,” well, the lead accounting officer for a state government should have been a little more careful.
The City of Big Shoulders sets sail on a spending -- oops, ‘investment’ -- spree
December 1, 2021
Awash in liquidity, at least for now, the City of Chicago is setting sail for a historic spending spree. In late October, the City Council passed Mayor Lori Lightfoot’s latest annual budget. The city is planning to spend $16.7 billion in 2022 – 40 percent more than the city’s budget just two years ago.
In late 2019, anyone predicting the financially-desperate City of Chicago would be planning to spend 40 percent more money in two years might have drawn a few laughs. Yet here we are – after a worldwide pandemic and government lockdowns brought federal money raining down on more than a few financially challenged state and city governments.
In the letter introducing her “2022 Budget Overview”, Lightfoot framed the planned spending in terms of a goal to “build a stronger and more prosperous city,” and declared “We are the City of Big Shoulders.” But Uncle Sam’s shoulders are a big part of the story. Whether Uncle Sam can carry the load it has undertaken will be an important theme to watch in the years ahead.
The City of Chicago included $6 billion in grant funding – mainly federal government spending – in its anticipated resources for the 2022 budget. That’s 36 percent of the $16.7 billion. Here’s a look at what the city has budgeted for grant funding each year since 2015.
Grant funding hasn’t been the only thing ballooning in Chicago’s finances in recent years. Here’s a look at the amounts the city has budgeted for pension fund contributions since 2011.
In 2022, Chicago plans to sock away nearly $2.5 billion for its employee pension plans – four times as much as it was contributing back in 2015. Announcing the latest budget, Lightfoot claimed that
“In 2022, with the Budget we are proposing, we will climb our pension ramp, which means that for the first time in our city’s history, and [sic] all four pension funds will be paid on an actuarially determined basis. This is huge.”
Even if true, it wouldn’t be so huge. It would only imply that Chicago stopped digging its massive long-term financial hole deeper. Trouble is, as Elizabeth Bauer documented in Forbes back in October, Chicago’s “actuarially determined basis” is based on legislative accounting, not the full Actuarially Determined Contribution required to keep the pension liability from growing.
Still, the City of Chicago plans to come up with almost $500 million more in pension contributions next year. One has to wonder how easy that would have been absent the pandemic and related federal government “stimulus.”
In its latest (2020) audited financial statements, the City of Chicago reported an unrestricted net position (akin to shareholders equity, in private sector corporate financial statements) of ($37.4 billion). The dollar amount is in parentheses because it is a negative number. The $37.4 billion 2020 hole was almost $8.5 billion deeper than in 2015.
When you are this deep into a hole, how do you justify a budget 40 percent higher than it was before the arrival of a worldwide pandemic? Besides praising the leadership of the Biden administration and the fiscal response of the federal government to the pandemic, Lightfoot doubled down on a longstanding tendency of city leaders to call spending “investment.”
In a late-September press release announcing the latest budget proposal, the Mayor’s press office included the word “invest” 60 times. The word arrived 25 times in the text of the 2-page release, and another 35 times in a series of 36 statements from various leaders of organizations supporting the budget. One paragraph in that press release captures the essence of the messaging:
“Importantly, the 2022 Recovery Budget includes investments that build a better Chicago by increasing safety and opportunities. To make those conditions a reality, the investment strategy is driven by two key principles: investment in families and neighborhoods will increase community safety; and investment in Chicago’s economic engine will support an equitable recovery.”
Maybe that’s one way to try to sell this bill of goods. Investments provide a return, hopefully, a positive one. While that may be uncertain, certainly from the point of view of the city as a whole, the recipients of the spending will certainly be getting some money. From the city government and taxpayer perspectives, however, the programs established under new 2022 spending may launch expectations for continued spending in those areas. That sounds more like a liability, not an investment “asset.”
Federal aid may seem like a reliable thing to depend on. But as our financial markets regularly and sadly remind us, federal government “stabilization” programs can fundamentally undermine true stability, given the moral hazard implications. Bailouts and bailout expectations spawn riskier behavior, especially if concentrated, well-organized special interest groups benefit while average citizens and taxpayers bear downside risks.
Chicago’s aggressive growth plans for 2022 may set the stage for a more violent unwinding if federal largesse does not continue. Especially if the federal government victimizes its own finances with its current largesse.
I’m a fan of metaphors. I hope the City of Chicago hasn’t set sail into a perfect storm. For that matter, having done that on a small boat, I hope it has.
Defense Department audit performance – backwards is forwards
December 9, 2021
The U.S. Department of Defense (DoD) released its annual financial report in mid-November. The report included the fourth consecutive “disclaimer” (flunk) audit opinion from the DoD Office of Inspector General. The DoD, with more than $3 trillion in reported assets, is one of the main reasons that the U.S. Government Accountability Office (GAO) has delivered a disclaimer of opinion on the overall financial statements of the federal government of the United States – every year since 1997.
In recent years, the DoD Office of Inspector General (OIG) has delivered a valuable supplementary report, titled “Understanding the Results of the Audit of the DOD Financial Statements.” We use that report to develop our annual DoD Audit Report Card, which evaluates and ranks the Army, Navy, Air Force, Marines, and 14 other DoD component entities on their audit performance. We will do so again early next year.
This article sets the stage for that project. It reviews the latest overall audit opinion and provides a summary comparison to last year’s opinion to begin to assess the progress the DoD has made. Last year, when interviewed about the results from our DoD Audit Report Card, I summarized along the lines that “they are making progress in the sense that they’re finding more problems than they resolve.” This appears to be the case again.
By way of background, our federal government began issuing financial reports in their current format following the Chief Financial Officers Act of 1990 (CFO Act). That act required each executive branch department to prepare annual financial statements, which are then used to develop a single consolidated set of statements that are included in the annual overall Financial Report of the U.S. Government.
The CFO Act also required audits of the departmental financial statements, at least in theory. But the DOD failed to deliver audited statements for more than two decades. It committed to developing a comprehensive audit around 2010, but it took seven more years to finally include an audit opinion with its financial statements. And from 2017 to 2021, the DOD Office of Inspector General marked those statements with a “disclaimer” opinion – a grade of “F.”
There are several types of audit opinions. An auditor delivers an “unmodified” (clean) opinion if it determines that the financial statements are presented “fairly” and “in accordance with generally accepted accounting principles.” If the statements fail to meet that standard, the opinion is “modified,” with the auditor noting the shortfalls responsible. A “disclaimer” opinion is harsher than a “modified” opinion, as the auditor finds that it simply doesn’t have reliable evidence needed to express an overall opinion, period.
The DOD OIG’s latest “Independent Auditor’s Report” appears on pages 65-95 of the DoD Agency Financial Report for the September 2021 fiscal year. Last year, the OIG report was on pages 75-100 of the overall report, so the auditor’s report this year is five pages longer than it was last year. This year’s report is longer not because it discusses successes, except to the extent that identifying and reporting more issues constitutes a step in the right direction.
The OIG Report includes an introductory memo from the OIG, a “Report on the Basic Financial Statements,” a “Report on Internal Control Over Financial Reporting,” and a “Report on Compliance With Applicable Laws and Regulations, Contracts, and Grant Agreements.”
Report on the Basic Financial Statements
The Report on the Basic Financial Statements includes a paragraph with the overall audit opinion. The language for that paragraph is identical with last year, including a depressing concluding note that “Thus, the basic financial statements may contain undetected misstatements that are both material and pervasive.”
This section of the OIG Report identified 14 different DoD component entities that received a disclaimer opinion, the same number (and entities) as last year. The Army, Navy, and Air Force all received disclaimers for both their General Fund and Working Capital Fund Statements.
One element of this section of the report, titled “Emphasis of Matter,” deserves emphasis. It opens with a discussion of “Security Assistance Accounts” (SAAs), including “Foreign Military Sales” and “Foreign Military Financing.” The financial statements for the SAAs, which are consolidated in the overall financial statements in the Financial Report of the U.S. Government, are included in an appendix to the DoD Agency Financial Report. But the OIG emphasizes that those statements have not been scheduled for an audit until fiscal year 2022, undermining any claims that the DoD’s audits for the last four fiscal years have been either “full” or “complete.”
In this section, the OIG also stressed that the “audit ready” Agency Financial Report it received on November 10 was incomplete, and that the DoD provided five different versions of the report between November 10 and November 15. Another matter emphasized by the OIG was that the Agency Financial Report restated fiscal year 2020 statements to correct errors in 13 different areas, and that the OIG was unable to audit the restatements. Notably, the number of areas identified by the OIG for being restated due to errors went up, not down, from last year, when only six areas were called out on this score.
Report on Internal Control Over Financial Reporting
This section identifies “material weaknesses” and “significant deficiencies” in DoD internal controls for financial reporting. This year, the report had lengthy paragraphs discussing 28 different material weaknesses (up from 26 last year) and four “significant deficiencies” (the same number as last year). Twenty-five of the material weaknesses were repeats from last year. One material weakness identified last year, the “Military Housing Privatization Initiative,” was upgraded to a less-severe “significant deficiency.” But the OIG identified three new material weaknesses, including “Financial Statement Compilation,” “Contingent Legal Obligations,” and “Reconciliation of Net Cost of Operations to Outlays.”
Again, if identifying more problems than the ones that are resolved constitutes progress, the DoD is making progress on it’s audit performance.
Below is a list of the material weaknesses discussed in this section.
· Legacy Systems
· Configuration Management and Security Management
· Access Controls
· Segregation of Duties
· Universe of Transactions
· Fund Balance With Treasury
· Suspense Accounts
· Inventory and Related Property
· Operating Materials and Supplies
· General Property, Plant and Equipment
· Real Property
· Government Property in the Possession of Contractors
· Joint Strike Fighter Program
· Military Housing Privatization Initiative
· Accounts Payable
· Environmental and Disposal Liabilities
· Beginning Balances
· Unsupported Accounting Adjustments
· Intragovernmental Transactions
· Gross Costs
· Earned Revenue
· Budgetary Resources
· Service Organizations
· Entity-Level Controls
· DoD-Wide Oversight and Monitoring
· Component-Level Oversight and Monitoring
· Financial Statement Compilation
· Contingent Legal Liabilities
· Reconciliation of Net Cost of Operations to Outlays
In turn, below are the four “significant deficiencies” discussed in the report.
· Transition to Risk Management Framework
· Defense Agency Deposit Fund Accounts
· Accounts Receivable
· Military Housing Privatization Initiative
The “Transition to Risk Management Framework” and “Accounts Receivable” discussions were repeats from last year. The “Defense Agency Deposit Accounts” deficiency was a new arrival this year. The “Legal Contingencies” discussion in last year’s significant deficiencies was not repeated this year, but only because “Contingent Legal Liabilities” became a new, more serious material weakness. Likewise, the “Reconciliation of Net Cost of Operations to Outlays” discussion appeared as a material weakness this year, after appearing as a significant deficiency last year.
Report on Compliance With Applicable Laws, Regulations, Contracts, and Grant Agreements
This year’s report identified and discussed seven different Acts of Congress where the OIG determined that the DoD was not in compliance. In harsher terms, one could assert that the DoD is breaking the law. These laws included:
· The Antideficiency Act
· The Federal Financial Management Improvement Act of 1996
· The Federal Financial Managers’ Financial Integrity Act of 1982
· The Federal Information Security Modernization Act
· The Debt Collection Improvement Act
· The Prompt Payment Act
· The Coronavirus Aid, Relief, and Economic Security Act
Again, each of these areas were repeats from last year. Granted, it has only been a year. But four years ago, the OIG specifically identified only two laws – the Antideficiency Act and the Federal Financial Management Improvement Act – as areas with shortfalls. The noncompliance list has been growing , not shrinking.
Conclusion
In 1990, Congress directed executive branch departments, including the Defense Department, to produce audited financial statements. Thirty years and trillions of dollars later, the DoD has yet to secure a clean audit opinion. Granted, it has finally embarked on the audit process, and the auditors and auditees remain on a learning curve. But a review of the latest audit results reveals precious little evidence of positive progress.
Consider a case where a defense contractor had this kind of accounting and auditing history. The DoD may stop contracting with that organization. Might that imply that the Congress should stop contracting with the DoD?
We will be taking a deeper dive soon. The American people deserve better than this.
A “State Chestpounding Index"
December 10, 2021
If you were trying to understand and rank businesses on their customer service, would you rather trust a survey of what businesses said about themselves, or a survey of what their customers said?
There are a variety of rankings out there calling themselves something like “Best States for Business.” They have different methods. For example, the Small Business & Entrepreneurship Council (SBE Council) has published a “Small Business Policy Index,” based on a thorough analysis of 62 factors relating to taxes, regulations, government finances, and business support programs. Chief Executive Magazine takes a different tack with its annual “Best States for Business” ranking, surveying CEOs directly for their views on state tax policy, regulation, and talent availability.
The CNBC news network takes yet another tack with their “America’s Top States for Business” rankings. In their own words, CNBC says:
To rank America’s Top States for Business in 2021, CNBC scored all 50 states on 85 metrics in 10 broad categories of competitiveness. Each category is weighted based on how frequently states use them as a selling point in economic development marketing materials. That way, our study ranks the states based on the attributes they use to sell themselves.
Businesses can be considered customers of government services, including government regulations on business. In return, they (and their own customers) pay taxes. Is it possible that a survey of what governments say about their business-friendliness tells you something different than what a survey of what businesses says about how friendly their government is?
Yes.
Using the tools available in our Data-Z website, I just developed a “State Chestpounding Index.” First, I examined the correlations for the 50 states on the three different surveys noted above. The CEO Magazine and SBE Council rankings are significantly positively correlated with each other, but neither of them are significantly correlated with the CNBC rankings.
Then, I put together a simple average of the rankings for CEO Magazine and SBE Council for each state, and subtracted the CNBC ranking for each state. The 10 states with biggest positive difference between the CNBC rankings and the average for the CEO Magazine and SBE Council rankings – states that score better on CNBC than to be expected by the average for those other two rankings – are:
· California
· Connecticut
· Illinois
· Maryland
· Massachusetts
· Minnesota
· Nebraska
· New Jersey
· New York
· Washington
Coincidentally, or not, the average “Taxpayer Burden” that TIA calculates for these ten states runs six times higher than the average for the rest of the states in the nation. And those 10 states tend to rank significantly worse on United Van Lines latest migration survey (the more chestpounding, the higher the outmigration).
A “State Chestpounding Index.” Or a “State Desperation Index.”
Susana Mendoza: Taxpayer advocate?
December 15, 2021
Eight states have called for the federal government to extend a waiver on interest payments owed on their borrowings from Uncle Sam for unemployment insurance programs. In an article in today’s hard-copy Chicago Tribune written by Dan Petrella, a statement from Illinois Comptroller Susana Mendoza included:
“Taxpayers should not be on the hook for interest just because the pandemic is lasting longer than projected.”
Mendoza may seem like she cares about taxpayers. Putting aside whether she really cares about Illinois taxpayers, specifically, consider whether what she is arguing for helps U.S. taxpayers in general.
Do you remember the line “What’s good for General Motors is good for America?” Here, a self-interested politician appears to be claiming what is good for Illinois is good for American taxpayers.
But who is on the hook for foregone interest to date that the state government in Illinois would have owed to the federal government, and for interest foregone in the future if this waiver is extended?
Taxpayers, including Illinois taxpayers, who pay tax to the federal government.
Granted, Illinois taxpayers have a vested interest in federal benefits for the state government of Illinois. But what do American taxpayers in general think?
The answer to that question may help explain why the seven states reportedly joining Illinois in sending a letter to U.S. Treasury Secretary Janet Yellen were Connecticut, Massachusetts, Colorado, New Jersey, Minnesota, New York, and Pennsylvania. Truth in Accounting calculates the average “Taxpayer Burden” (a measure of government financial position) for these eight states as six times worse than the average for the other 42 states.
The Chicago Tribune's story today appeared under a headline “States ask feds to freeze interest on loans used to pay jobless benefits.”
The headline didn’t say “Eight States.” It started with “States.” But Petrella’s article concluded with healthy and provocative paragraphs effectively questioning the veracity of Illinois officials’ claims, and whether those eight states are relying on taxpayers in other states to bear the costs of what they are asking for.
It's also worth recalling that Illinois Comptroller Mendoza falsely claimed the State of Illinois Auditor General delivered an unmodified audit opinion on Illinois' latest financial statements -- and that the auditor's opinion was modified in important part due to accounting issues afflicting the State of Illinois' unemployment insurance program.
Is inflation ‘our’ fault? Little taxpayers and consumers?
December 16, 2021
Inflation is a tax, and a pernicious one. Measuring inflation isn’t easy, and government statistics purportedly measuring inflation are subject to significant accounting issues. In recent months, however, inflation has certainly risen on the radar screen.
You don’t have to be an expert in hedonic price indexes, or related “quality adjustment” statistical issues, to get the picture these days. Especially in the last week, as both the Consumer Price Index and the Producer Price Index posted historically large increases.
In an entertaining and valuable December 14 Wall Street Journal (WSJ) op-ed, Michael Munger noted that “President Biden has proposed various plans to deal with inflation,” and he quoted eminent economist Mike Tyson – “Everybody has a plan until they get punched in the mouth.”
Who’s doing the punching? Who is the opponent?
The WSJ printed a page-one article a few days ago titled “How do you feel about inflation? The answer will help determine its longevity.” The article, written by Nick Timiraos and Gwynn Guilford, opened with these two paragraphs:
Supply-chain disruptions, labor shortages and climbing oil prices have pushed inflation to a 39-year-high. But attention is now focused on another variable: Do people think inflation is here for a while?
Because people’s expectations can factor into inflation, the answer plays a critical role in determining how the Federal Reserve and the administration manage the rising numbers—and how soon and how much the Fed will raise interest rates.
Here, the front page of the WSJ (not the editorial or op-ed pages) offers opinions about what causes inflation. “Supply-chain disruptions,” “labor shortages,” and “climbing oil prices,” first and foremost - supplemented by “how we feel” conjectures. In turn, it sounds like the Fed is our bedside psychologist. Maybe we need to heed its counseling, behave, and adjust our expectations accordingly.
But what if the Fed’s monetization of massive fiscal expansion has been a cause of the problem? What if the bedside doctor is supposedly the “cure” for a disease it inflicted on us?
In their WSJ article cited above, Timiraos and Guilford did not include the word “money,” or the phrase “money supply.”
Yesterday, John Mauldin tweeted with a post he had in his popular newsletter. The tweet included this graph from “The Daily Shot.” Maybe the money supply matters, after all.
People are fleeing hi-tax states with poor government financial management
January 4, 2022
Yesterday, United Van Lines (UVL) released its annual “National Movers Study.” UVL is one of the largest moving companies in the US, and has done this survey since 1978. The study calculates the share of outbound moves out of total UVL interstate moves for each of the continental 48 states.
In the latest results, New Jersey, Illinois, New York, Connecticut and California were the five states with the highest outmigration. All five of these states rank in the bottom ten states based on Truth in Accounting's "Taxpayer Burden" measure of state government financial condition.
More generally, how do high outbound states differ from high inbound states? What factors are associated with the migration patterns identified by UVL? These questions can be explored with the data and charting tools at Truth in Accounting’s “Data-Z” website facility.
The chart below ranks 10 financial, economic and demographic factors in terms of their association with UVL’s latest rankings on outbound migration. The factors are ranked from lowest to highest in terms of the significance/strength of their relationship with UVL’s migration rankings. The black line shows the absolute value of the difference between state rankings on that factor for the 10 highest and lowest outbound migration states. The red line shows the correlation coefficient for the factor rankings and the rankings for outbound move percentage, for all 48 states.
Moving from left to right, the stronger the relationship. The ten factors and the direction of the relationship are described below the chart.
RPP => Regional Price Parity. People tend to be moving out of states with higher living costs as measured by this U.S. Census Bureau statistic. This is the least significant of the 10 explanatory factors.
WAT => Winter Average Temperature. People tend to be moving out of colder winter states. This is the second-least significant of the 10 factors.
CFR => Cato Freedom Index. People tend to be moving out of “less-free” states, as measured by the Cato Institute’s latest “Freedom in the 50 States” ranking.
AOR => ALEC Economic Outlook Ranking. People tend to be moving out of states ranking lower on the American Legislative Exchange Council’s latest Economic Outlook Ranking.
BSB => Best States for Business Ranking. People tend to be moving out of states ranking lower on Chief Executive Magazine’s latest Best States for Business survey ranking.
TIA => Taxpayer Burden Ranking. People tend to be moving out of states ranking worse on Truth in Accounting’s latest “Taxpayer Burden” ranking of state government financial positions.
CBA => Collective Bargaining Agreements. People tend to be moving out of states ranking higher on the share of public sector employees covered by collective bargaining agreements.
BBF => Balanced Budget Frequency. People tend to be moving out of states that rank lower on how often their state government kept accrual expenses below accrual revenue, annually, since 2005. There is a strong relationship between Balanced Budget Frequency and Truth in Accounting's "Taxpayer Burden" -- states that have regularly kept accrual expenses in line with or below accrual revenue tend to be in better financial condition today.
LPC => Lawyers Per Capita. People tend to be moving out of states that rank higher on lawyers per capita. This is the second-strongest relationship of the 10 “explanatory factors.” There could well be a longer "public choice school of economics" story here. But curiously, there is a strong negative relationship between Lawyers Per Capita and Balanced Budget Frequency. Lawyer-intensive states tend to have governments in worse financial condition, and have significantly lower balanced budget frequencies -- legal "balanced budget" requirements notwithstanding.
WHR => WalletHub Ranking. People tend to be moving out of states that rank higher on WalletHub’s latest ranking of current taxpayer burdens (taxes paid as a share of income). This is the strongest relationship of the 10 factors.
This is a simple listing of bilateral relationships. It's not a sophisticated econometric model. But it points in directions of concern, and areas for improvement.